Multi-Segment Sequence Diagram
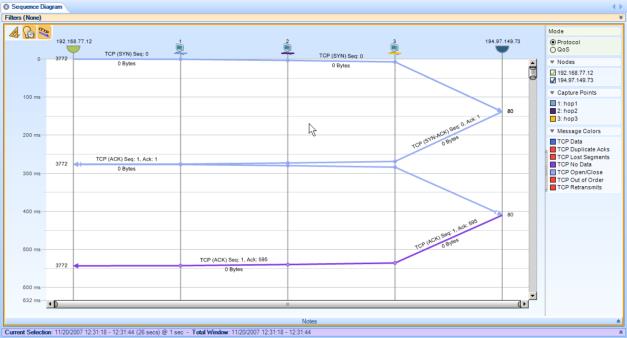
When a multi-segment sequence diagram view is applied to a multi-segment source, the resulting sequence diagram shows traffic between nodes across multiple segments in a network. In the following diagram, hosts are indicated by half-circles and capture points in the network are indicated by console icons.
For additional information on multi-segment analysis, refer to the section on “Multi-Segment Analysis (MSA).”