Data Grid Chart
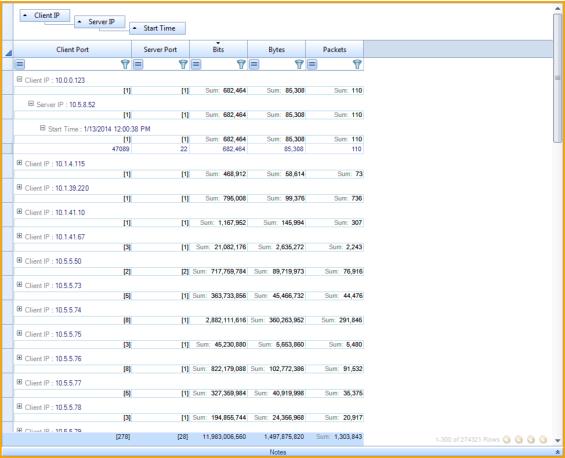
The Data Grid chart shows quantitative information pertaining to a number of metrics in a hierarchically arranged grid. The grid has rows and columns.
The columns can be:
◼ Rearranged in any order
◼ Resized
◼ Hidden and shown
The rows can be:
◼ Filtered
◼ Sorted by
◼ one or multiple columns simultaneously
◼ Hierarchically grouped
◼ Summarized by selection, group, or the entire table.
The figure below shows an example grid with a number of features enabled and some grid components identified.