Exporting a Trace Clip
You can send a trace file out from Packet Analyzer Plus to a PCAP file, or directly to Wireshark or SteelCentral Transaction Analyzer. The packet format and timestamp precision used when exporting trace clips are configured in the Settings dialog. (Choose Menu > Settings in the Ribbon bar).
Wireshark version 2.4.1 or later is required for use in conjunction with Packet Analyzer Plus.
Right-click on the trace clip in the Jobs Repository and choose Send To from the context menu. Choose one of the following options:
◼ Wireshark – This launches a Wireshark session and loads the trace clip (if you have Wireshark installed).
◼ Wireshark With Filter – Apply an existing filter to the trace clip before exporting it to Wireshark.
◼ SteelCentral Transaction Analyzer – This launches a Transaction Analyzer session and loads the trace clip (if you have Transaction Analyzer installed). A series of dialogs will appear, showing the progress of Transaction Analyzer launching, including authentication.
◼ SteelCentral Transaction Analyzer With Filter – Apply an existing filter to the trace clip before exporting it to Transaction Analyzer.
◼ File – This writes the trace clip to a PCAP file. The exported file is written to My Files on the AppResponse system.
◼ File With Filter – Apply an existing filter to the trace clip before writing it to a PCAP file.
Multi-Segment Analysis (MSA)
Multi-segment analysis (MSA) allows you to combine traffic data captured over the same time period from different locations on the network so you can view and analyze the traffic flows.
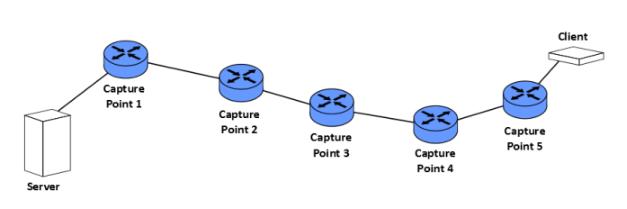
Typical network path using multiple segments between hosts
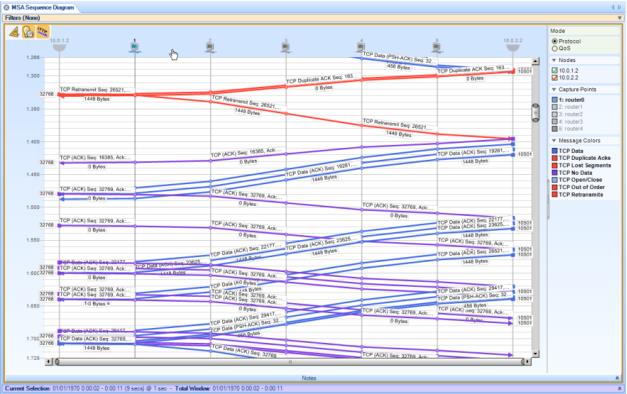
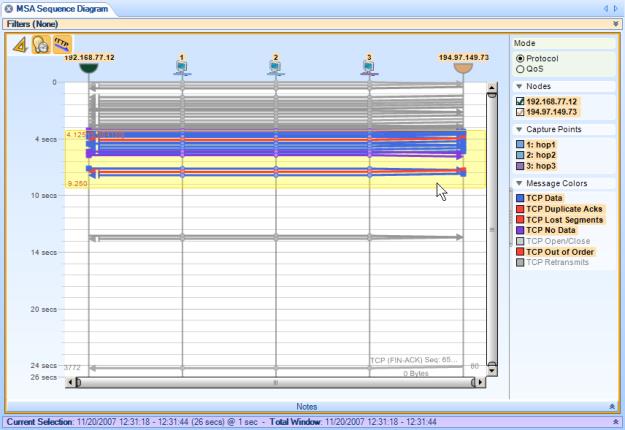
Typical multi-segment sequence diagram showing traffic flows through capture points between hosts
General Approach
Review Timestamp Settings At The Packet Source
Accurate timestamps at the packet source and capture points are critical when performing multi-segment analysis. Inaccurate timestamps are very difficult to adjust automatically or manually, and frequently result in a failed MSA view.
Observe the following practices to minimize timestamp issues when performing MSA analysis:
◼ If possible, use hardware taps to provide timestamps. Such devices can coordinate timestamps across network locations and help ensure accurate timestamps.
◼ Use NTP or other highly-accurate time references. Be sure that all capture devices reference the same time source.
◼ When using a hardware tap, make sure that your AppResponse 11 system specifies the correct tap type when configuring the capture interface.
If your multi-segment source name indicates a problem “Some invalid timestamps found” follow the steps under “
Adjust Time Skews (If Necessary)” to correct the problem. If your attempt to correct the problem fails, you need to check your timestamps and create new capture files.
Assemble The Data
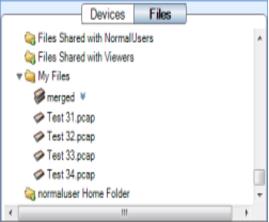
Put all your source data in one place. Packet Analyzer Plus requires that all of the source capture files or trace clips that you use be in one location—either on a single AppResponse 11 system or on the computer that runs Packet Analyzer Plus.
All the data processing for multi-segment analysis occurs locally on the AppResponse 11 or Packet Analyzer Plus local system where the data sources are stored. If that processing takes place on an AppResponse 11 system, only the results are sent across the network for Packet Analyzer Plus to display.
Use small source files. If your capture files are large and you know that the time interval of interest is small, use trace clips that cover that interval. When sending files across the network to a central location, smaller files use less network bandwidth.
You may be able to use high-level views, even if not multi-segment views (such as network usage by traffic type) to narrow down the interval of interest. Then you can drill down with multi-segment views.
Make A Multi-Segment Source
1. In the Files section of the Sources panel, select two or more sources that you will combine into a multi-segment source. (Use a click and multiple control-clicks, or a click and a shift-click.)
2. Right-click one of the sources to bring up a context menu. Click Create Multi-Segment Source.
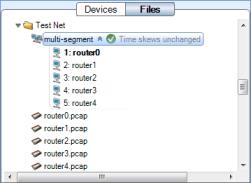
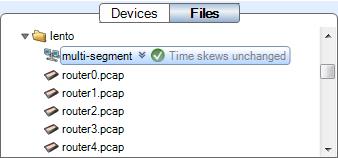
Packet Analyzer Plus builds a multi-segment source and lists it in the Files panel. One of the segments is designated as the primary segment and shown in bold type. The primary segment is generally used when a single-segment view is applied to the multi-segment source.
Adjust Time Skews (If Necessary)
Packet Analyzer Plus automatically adjusts the time skews between capture points, so in most cases you won’t need to do anything. If the adjustment succeeds, the Files panel shows the multi-segment source with a green check-mark icon.
If the adjustment fails, the check-mark icon is yellow and has a brief explanation of why it failed.
…
You can run the time skew adjustment by right-clicking the multi-segment file and selecting Estimate Time Skews from the context menu that appears. The initial time skew estimate made when the multi-segment file is first created samples 1000 packets. When you right-click and select Estimate Time Skews, the computation uses all the packets in the sample. This should be somewhat more accurate, though it may take more time to compute.
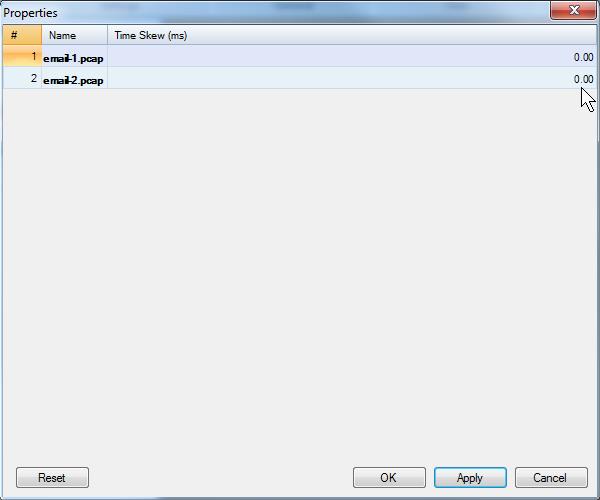
You can enter your own time skew values by right-clicking the multi-segment file and selecting Properties. The individual source files are listed, and each one has a time skew value that you can adjust manually.
You may find it difficult to arrive at time skew values that improve on the automatic adjustments made by Packet Analyzer Plus. As an alternative, make sure that the timing values that go into your source data are as accurate as they can be:
◼ The AppResponse 11 software supports taps that can add more accurate timestamps to packets. Hardware tap vendors can also ensure that captures taken at different locations can be coordinated by GPS or CDMA signals. Make sure that you specify the correct tap type when configuring the NIC interfaces on your AppResponse 11 system.
◼ Use NTP or better time sources as your time reference, and make sure that all of your capture devices are referenced to the same source.
When timestamping is perfectly synchronized among AppResponse 11 systems capturing trace files for multi-segment analysis, you should expect the time skew to equal 0.
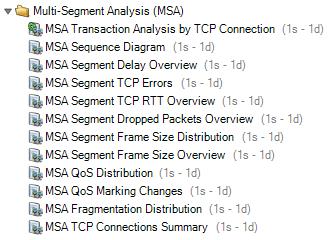
Apply Views
There are several views designed specifically for multi-segment analysis. You can find them easily by using the Search box (at the top of the Views panel) to search for “segment” or “MSA”.
Once you have applied a view you can select an area of interest and drill down (apply additional views). But note that:
◼ You can’t apply a multi-segment view to a normal (single-segment) trace file.
◼ If you apply a single-segment view to a multi-segment file, the view uses one trace. But if you drill down further with a multi-segment view, it uses all of the traces of the multi-segment file.
◼ When you can see all capture points in a multi-segment view, if you drill down further you can choose which capture points to include.
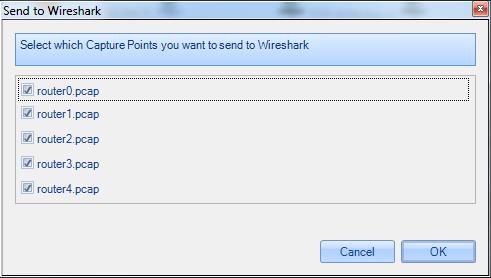
If you right-click a selection in a multi-segment view and choose “Send to Wireshark” from the context menu, a pop-up dialog lets you choose which capture points to use. For each capture point you choose, the packets in the selection are sent to a separate instance of Wireshark.
Wireshark version 2.4.1 or later is required for use in conjunction with Packet Analyzer Plus.
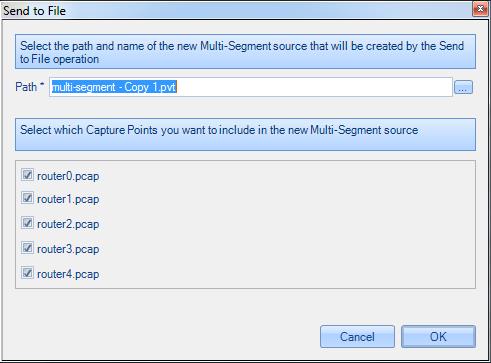
If you right-click a selection in a multi-segment view and choose “Send to File” from the context menu, a pop-up dialog lets you choose which capture points to use as sources for the new multi-segment file that corresponds to the selection.
Navigating A Multi-Segment Sequence Diagram
There are several different ways to view the information in a sequence diagram. Choose the combination that works best for you.
Select And Zoom
◼ Click and drag in the view to select a time interval to examine more closely. Then double-click the selection to zoom in.
◼ To deselect, click anywhere inside the main window.
Use The Slider
◼ Drag the time slider up or down to move backward or forward in time.
◼ Drag the end of the slider in or out to zoom in or out.
◼ Double-click the middle of the slider to view the full time interval (unzoomed).

Use The Mouse Wheel Or The Up- And Down-Arrow Keys
Click anywhere inside the main window. Then:
◼ Hold down the CTRL key and scroll—using the mouse wheel or the up- and down-arrow keys— to zoom in or out. Zooming is centered on the cursor. (That is, the area around the cursor stays in place while the rest of the window moves in or out.)
◼ Release the CTRL key and scroll to move forward or backward along the time line.
With a little practice, you will find that you can navigate the sequence diagram very quickly by scrolling and alternately holding or releasing the CTRL key.
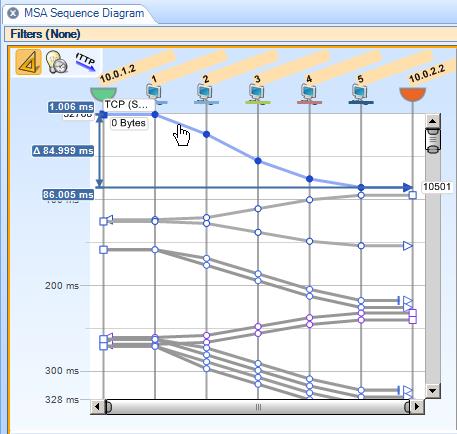
View Delays And Round-Trip Times
Click the Ruler Mode button to enter ruler mode. Then click a message line to see the delay for that message (the time it takes to go from the source node to the destination node). Note that the timing for capture points is precise, but that timing for end points is estimated.
Or click a start point and an end point to see the time difference between any two time points on the sequence diagram.


 Square dots represent the source of a message.
Triangular dots represent the destination of a message.
Circular dots represent capture points along the path of a message through the network.
Unselected points are open; when you click a point, it fills with the color of the message line.
Ruler mode also shows the time span covered by a selection.
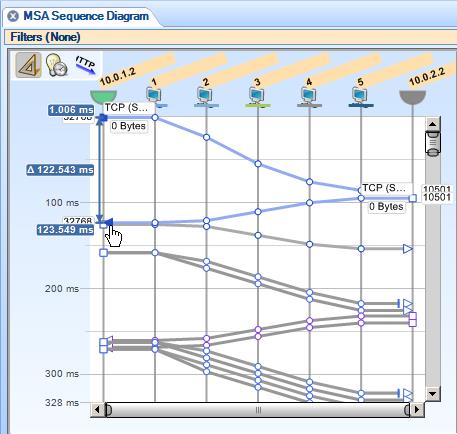
Estimate Network Delays
Click the Time Hints button to generate an estimate of network delays. The delays are inferred from the capture data and show up as sloped, rather than flat, timelines between the hosts and their nearest capture points.
Label Message Lines
Click the Message Labels button to label the message lines with protocol information, byte counts, and so on.
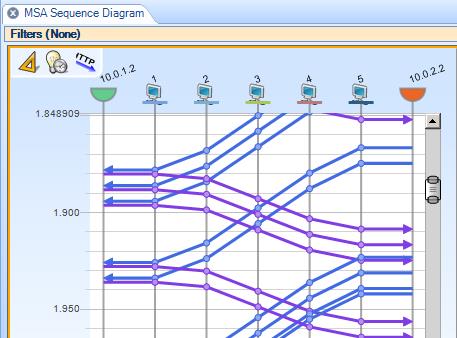
Simplify A Sequence Diagram
Sequence diagrams can get complicated. They are best used on small traces, or after drilling down from a larger data set.
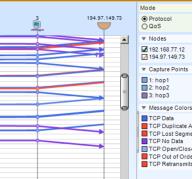
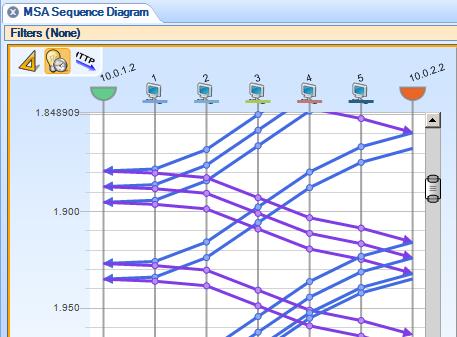
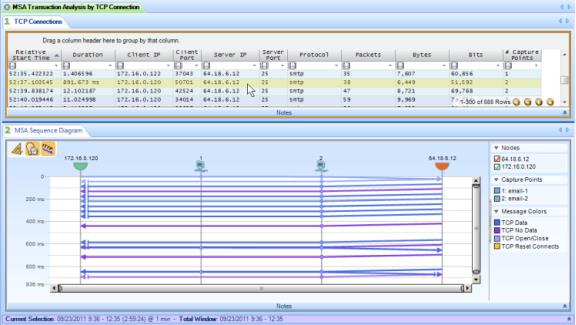
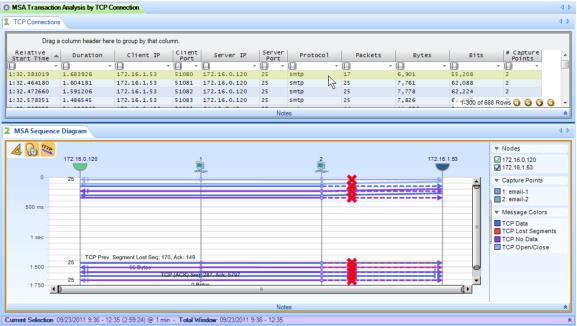
You may be able to simplify a sequence diagram if you know the TCP connections. For example, here is a somewhat complicated sequence diagram created by the MSA Sequence Diagram view.
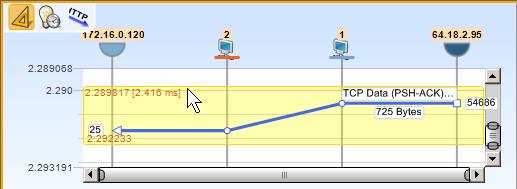
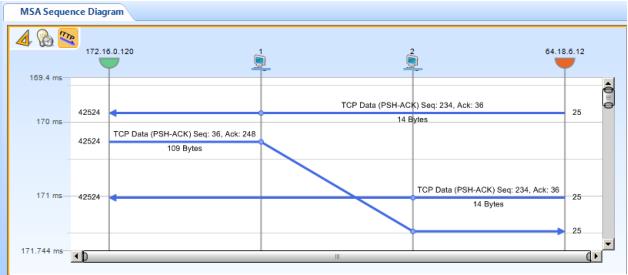
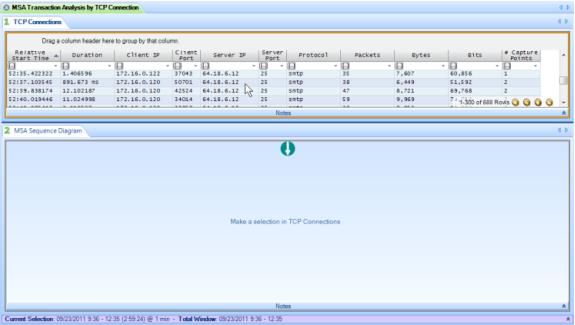
If you know the TCP connection you want to see, you can apply the MSA Transaction Analysis by TCP Connection view to the same data. Choose the connection you want from the data grid…
…and a simplified sequence diagram, showing only that TCP connection, is displayed in the lower window.
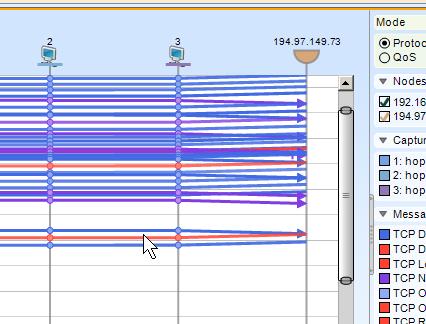
You can then zoom in more easily and continue your analysis.
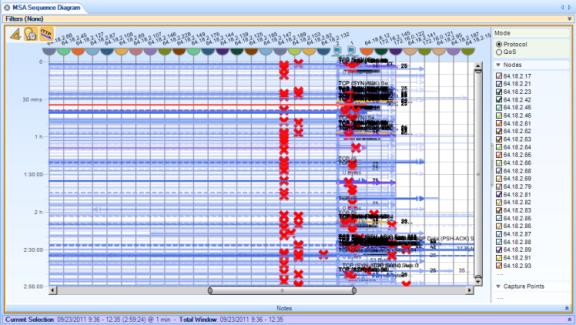
If you are trying to track down a problem but don’t know the TCP connection, you can quickly select successive TCP connections from the data grid until a troublesome-looking one appears.
Then you can zoom in, drill down, and diagnose the problem.