Monitoring SaaS Acceleration
This chapter describes how to monitor SaaS Accelerator components and usage. It includes these sections:
Monitoring initial SaaS traffic
You can review the connection activity and status on the appliance on the Reports > Networking: Current Connections page.
For a new cluster, the SaaS application classification for the first connection is not recognized (it does not yet match the in-path rule) and the connection is passed through.
First SaaS connection intentionally passed through
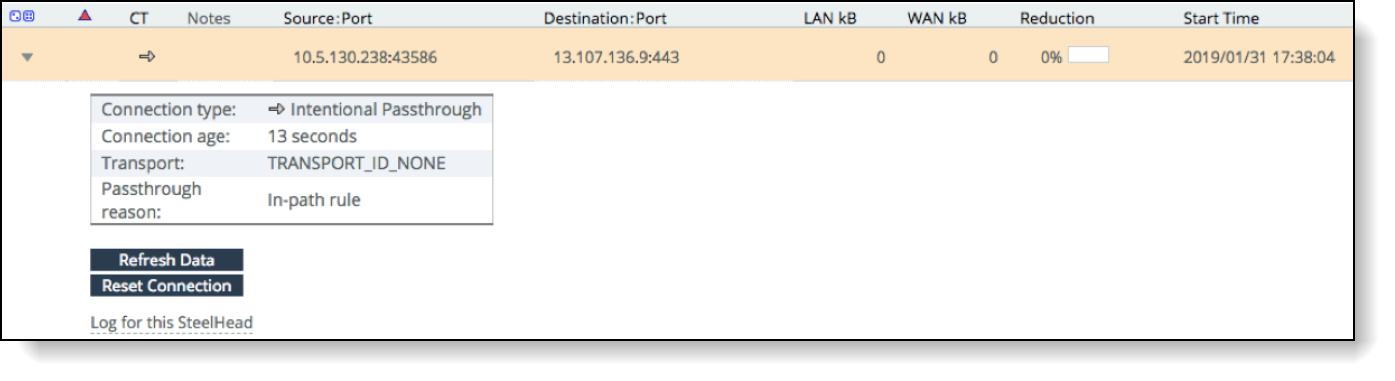
The appliance uses the first connection to classify the application, and the application classification will be recognized for the second connection.
Subsequent connections are recognized and redirected to the SaaS service cluster. The initial connection to each service instance will generate an SSL error while the SaaS service cluster obtains the proxy certificate for the traffic to accelerate.
For SteelHead Mobile, you can review the connection activity and status of clients either from the Endpoint Report on the SteelCentral Controller for SteelHead Mobile or from the Status tab of an individual SteelHead Mobile client.
SteelHead Mobile begins to accelerate SaaS traffic after receiving the updated policy with the SaaS application in-path rule and SaaS Accelerator is enabled. For SteelHead Mobile communication with a new cluster, the first connection is intentionally passed through to classify the application and acceleration begins with the second connection. SteelHead Mobile might encounter SSL errors and pass through traffic until the proxy certificate for the SaaS application is available on the SaaS service cluster.
Monitoring AppUnit usage
AppUnits are required for SaaS acceleration, and you need available AppUnits to configure applications for SaaS acceleration.
To view AppUnit usage
1. Choose Configure > SaaS Accelerator.
2. From the Accelerate Application drop-down list, select AppUnits Usage.
AppUnits Usage from Accelerate Application drop-down list
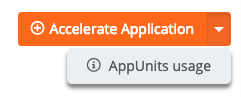
The AppUnits Usage dialog box shows the AppUnits purchased, the AppUnits assigned, and the available AppUnits.
AppUnit usage
This dialog box also shows the current assignments for configured SaaS applications.
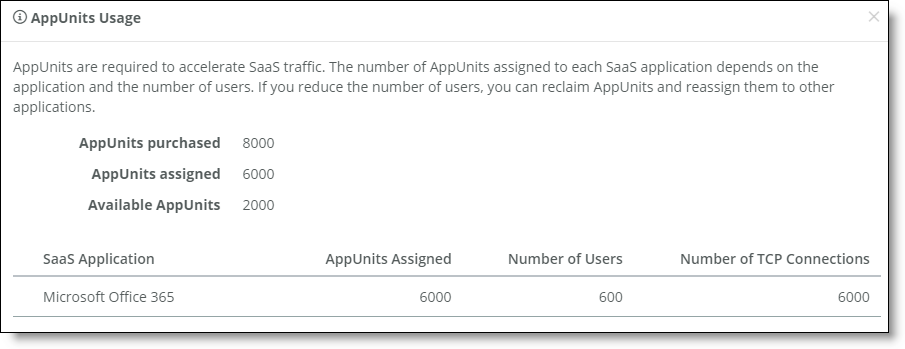
Monitoring SaaS connections
The SaaS Accelerator Connection Count report shows information about SSL/TLS connections for accelerated applications. Monitor this page to ensure your connection count remains below your connection limit.
To view connection usage
1. Choose Reports > Connection Count.
The SaaS Accelerator Connection Count page appears.
SaaS Accelerator Connection Count report
2. From the SaaS Application drop-down list, select to view all application connections or select a specific application.
3. Specify a time period for the report.
This can range from the last hour to the last year.
The report shows the concurrent SSL/TLS connections count for the selected application. Click the Connection Limit link at the bottom of the chart to display the connection limit based on the user limit specified on the SaaS Accelerator page when you configured the acceleration for the application.
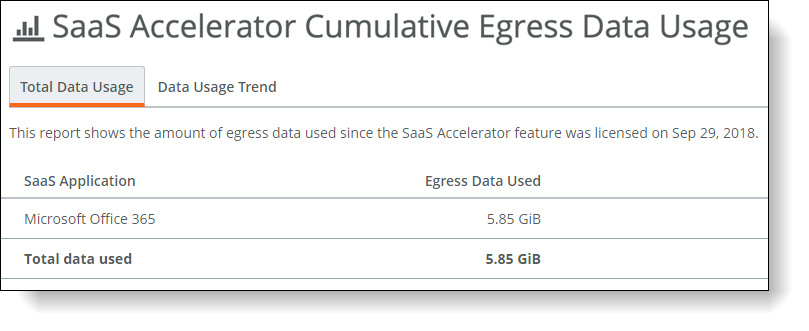
Monitoring SaaS data usage
The SaaS Data Usage report shows the amount of SaaS service data used since the SaaS Accelerator feature was licensed.
To view data usage
1. Choose Reports > Data Usage.
The SaaS Accelerator Cumulative Egress Data Usage page shows the usage history.
SaaS total data usage
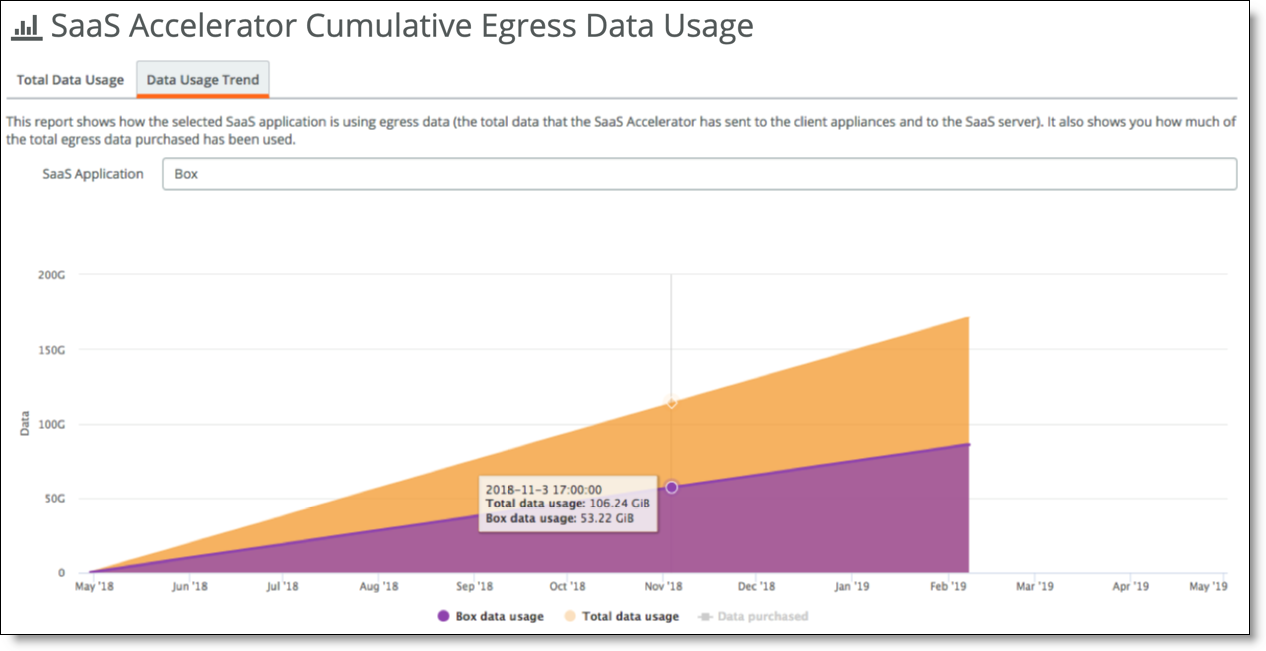
2. Select the Data Usage Trend tab to view application-specific data usage and see how application usage compares to overall usage.
Select Data Purchased (under the graph) to show how your data usage compares to the data limit provided by your license.
SaaS data usage trend
Monitoring data reduction for accelerated SaaS traffic
The SaaS Traffic Summary reports shows the total data reduction provided by SaaS Accelerator since it was configured and lets you filter it by time period. The report also shows the data reduction for each configured SaaS application.
To view data reduction
•Choose Reports > Traffic Summary.
The SaaS Traffic Summary page shows the overall data reduction and application details.
SaaS Data Reduction report
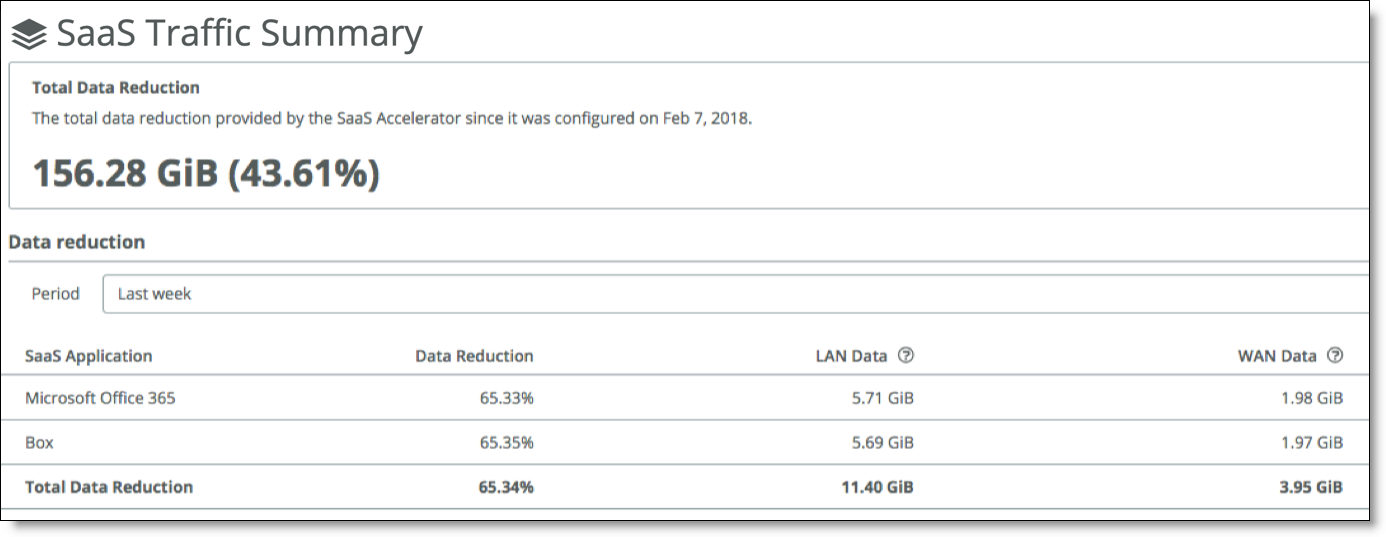
You can filter the results by time period ranging from the last hour to the last year.
The LAN Data column displays the amount of data transferred between the SaaS service cluster and the SaaS servers. The LAN data includes ingress and egress traffic on the SaaS LAN side.
The WAN Data column displays the amount of data transferred between the SaaS service cluster and the client-side appliances. The WAN data includes ingress and egress traffic on the WAN side.
Data Reduction is a percentage based on LAN data compared to WAN data.
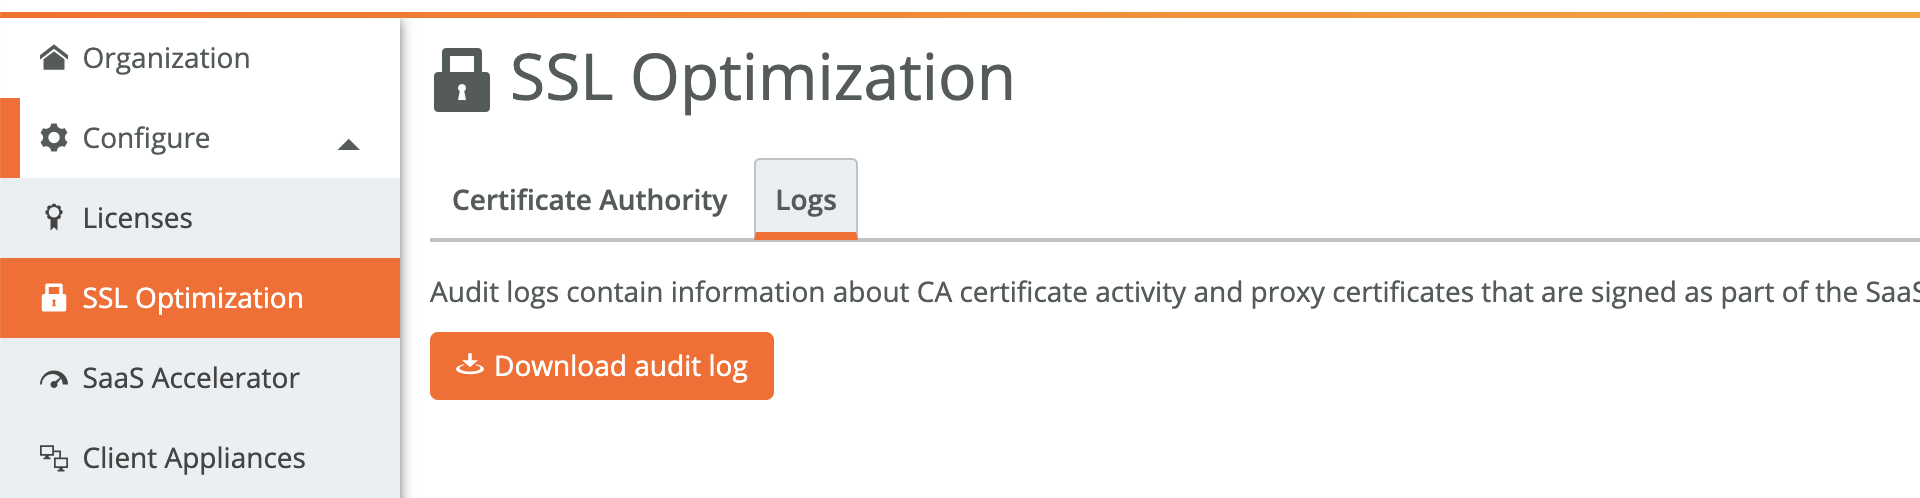
Monitoring certificate signing activity
From SAM, you can download a compressed archive of log files that shows the history and details of the certificate signing operations for SaaS acceleration. The log includes information for root CA, intermediate CAs, proxy, and peering certificates.
To review the certificate activity and log
1. In SAM, choose Configure > SSL Optimization and select the Logs tab.
2. Click Download audit log.
Downloading the CA audit log
Your browser downloads a ZIP-format archive file to your computer. Depending on your browser configuration, it might prompt you for a location to store the file or simply store the file in your default Downloads folder. The default name for this file is Organization_SaaS Accelerator_CA_Audit_Log.zip where Organization is the short name of your organization.
Opening the archive displays a text file with a name in the format:
SteelSecure_org-Organization-xxxxxxxxxxxxxxxx_audit.txt
where Organization-xxxxxxxxxxxxxxxx identifies your organization. This is the most recent audit log of certificate activity. There might be additional files with a date/time string appended. Each of these files contains audit log records for a previous period up to the date and time in the filename.
Each audit log consists of multiple lines of text that provide you the following details:
•A log line that includes:
–The date and time (in UTC) that the operation occurred.
–The Certificate Authority operation that was performed (create a CA, delete a CA, sign a peering certificate, or sign a proxy certificate).
–The organization or SaaS Accelerator service instance for the operation.
–The common name (CN=) of the certificate.
•The full text of the certificate in base-64 (PEM) format.
When signing certificates for a SaaS Accelerator service instance, the log line includes the Service Endpoint IP address. This enables you to easily correlate proxy certificates with the accelerated SaaS service in case the common name is not self-explanatory.
Monitoring SaaS acceleration from the SteelHead
From the SteelHead, you can use the SaaS Acceleration Status pane to monitor activity. This pane shows all SaaS applications configured for acceleration and shows the status of their in-path rules.
To display the SaaS Acceleration Status pane
•On the SteelHead appliance, choose Optimization > SaaS: SaaS Accelerator.
SaaS Acceleration Status pane
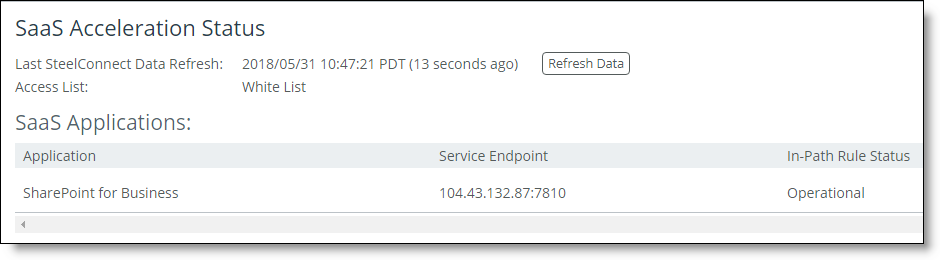
If the In-Path Rule Status is Operational, an in-path rule has been configured for this application. If the In-Path Rule Status is Not Configured, an in-path rule has not been configured. If the feature has been disabled, all SaaS applications display Not Operational.
The SteelHead gets data from SAM every five minutes and shows the time for the displayed data. Click Refresh Data to get the latest information.
Monitoring SaaS acceleration on Mobile Controllers
From the Mobile Controller, you can use the SaaS Acceleration Status pane to monitor activity. This pane shows all SaaS applications configured for acceleration and the list of policies for which in-path rules have been set up for SaaS acceleration.
To display the SaaS Acceleration Status pane on a Mobile Controller
•On the Mobile Controller, choose Configure > SaaS Accelerator.
SaaS Acceleration status pane
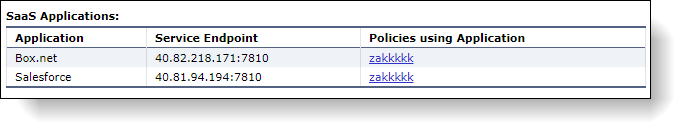
The SteelHead Mobile gets data from SAM every five minutes and shows the time for the displayed data. Click Refresh Data Now to get the latest data.
Monitoring SaaS service cluster status
From SAM, you can monitor the status of the SaaS service cluster for each accelerated application. Choose the Configure > SaaS Accelerator page to display the status.
SaaS service cluster status
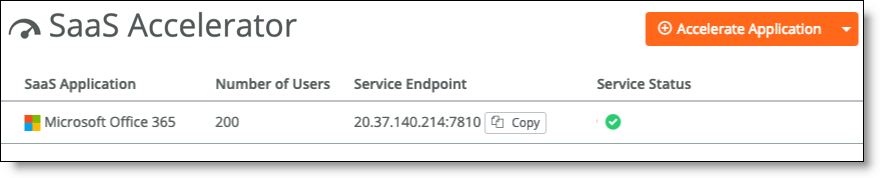
The service status can be one of these values:
•Healthy (Green) - The service cluster is operating normally and is capable of acceleration.
•Degraded (Yellow) - The service cluster is not functioning at full capacity.
•Critical (Red) - The service cluster is unavailable and is not accelerating SaaS traffic.