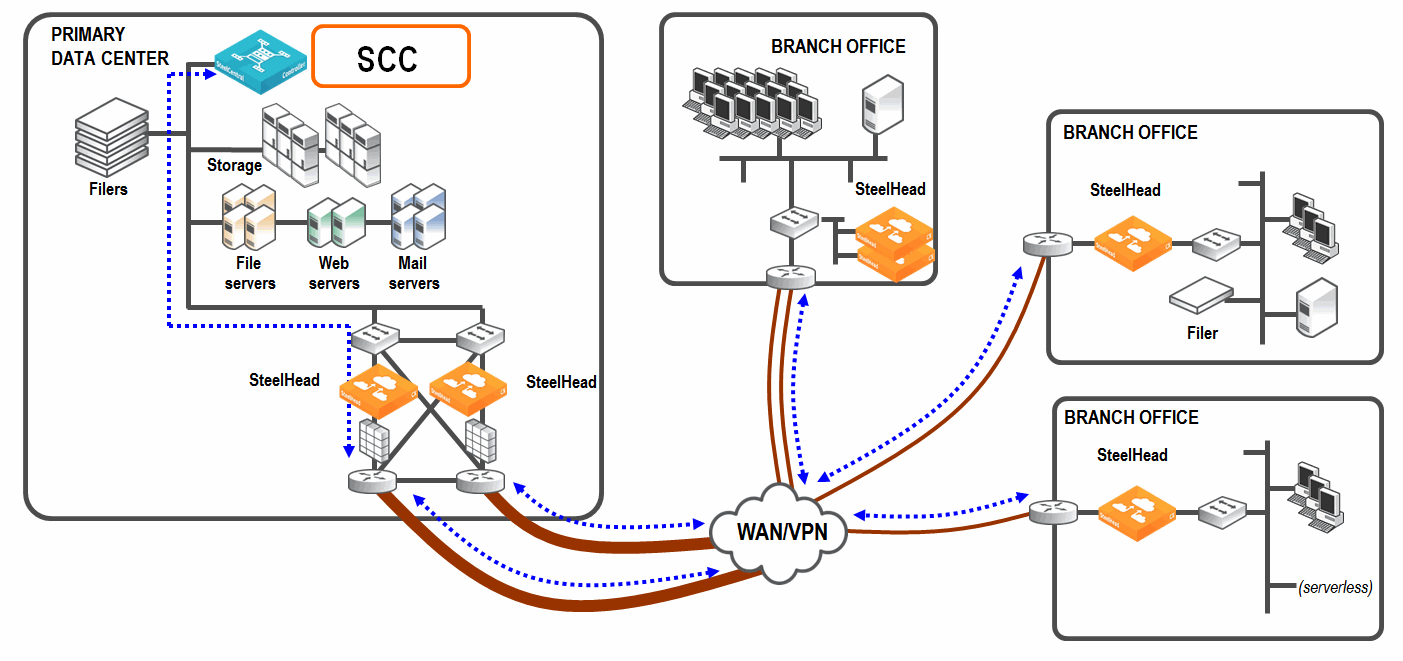
About SteelHead Central Controller
SteelHead Central Controller (SCC) serves as an enterprise configuration, management and reporting tool for your Riverbed products, giving you greater control over global network deployments.
Configuration policy management
SCC enables you to organize managed appliances into various logical groups, and set configuration policies specific to those groups or to individual appliances. This facilitates centralized, consistent configuration across many different appliances. Automatic configuration backup and rollback for managed appliances is also available.
Managed appliance monitoring
SCC provides both high-level status and detailed performance statistics of managed appliances and the controller itself. Controllers collect statistics from appliances every few minutes, and aggregates the data for every hour and day. Controllers store five-minute data points for 30 days, one-hour data points for 90 days, and one-day data points for three years.
Controller reports provide a view into the performance of the acceleration network, either from an aggregated perspective (groups) or per individual element. You can also configure event notifications for managed appliances.
Managed appliance maintenance and troubleshooting
SCC supports maintenance tasks such as software upgrades and appliance reboots. Controllers can generate system dump files on managed appliances and upload them to a Riverbed Support case number or a URL. You can also generate TCP dump files in the managed appliances.
SCC deployment
This chapter assumes you have already installed and performed the initial configuration of the SCC. We recommend using the Riverbed Management Console, rather than the command-line interface, to configure most SCC features.
About the Management Console
Each acceleration appliance includes a browser-based interface for easy configuration and management. After installing an appliance and doing the initial setup, you can complete custom configurations using this console.
The Management Console works with the latest versions of browsers from Google, Mozilla, and Microsoft. JavaScript and cookies must be enabled in your web browser.
If you prefer, you can also use the Riverbed command-line interface (CLI) for configuration, monitoring, and troubleshooting.
To log in, you need the appliance URL and user credentials. By default, the administrator login is admin with no password. The URL uses this format: <protocol>://<host>.<domain>
The <protocol> variable is http or https. We recommend HTTPS for secure access. When using HTTPS, the system prompts you to verify a self-signed SSL/TLS certificate. This certificate is regenerated if you change the hostname or when it expires. This certificate is not stored in the appliance's secure vault.
The <host> variable is the hostname assigned to the appliance’s primary interface during initial configuration. Optionally, you can specify the DNS name.
The <domain> variable is the full domain name for the appliance.
Alternatively, you can specify the IP address instead of the host and domain name.
The login page will vary depending on the authentication method set up. After logging in, you’ll land on the Dashboard, which shows system status and key summary information.
About the dashboard
After you connect to the Management Console, the Dashboard appears. The Dashboard provides a general overview regarding system status, including site status, the status of managed appliances, optimization savings, top applications, and bandwidth savings.
Local System Information
Displays the health status of managed appliances.
Site Status displays the health status of sites by site type: for example, branch office or data center and its location. In addition it lists the path selection status for each site.
Optimization Savings Over Last Month
Summarizes the average bandwidth reduction, average capacity increase, and total amount of data saved for the month. Mouse over the graph to view statistics for a specific time. You can also see WAN and LAN peak throughput (total optimized data transmitted for all applications) in the last month.
Top Applications
Provides a summary of bandwidth reduction across applications for optimized, pass-through, and combined (optimized and pass through) traffic for the top ten applications in the network. Application statistics help you make optimization policy decisions and allocate resources appropriately. Top Applications provides historical data for up to one week for the entire network.
Byte counts refer to Layer 3 packet size (that is, the IP header plus the payload) without the potential tunnel overhead or higher layer retransmissions. Mouse over the data for each application to view the WAN throughput. Click the application name to go to the Applications Details page where you can view throughput data. The units displayed are:
• Bits/second and averages per hour for optimized, pass-through, and combined traffic
• Optimized and pass-through traffic is WAN in and WAN out traffic.
• Combined traffic is optimized traffic plus the pass-through traffic
• 1 K is equal to 1000 bits, not 1024 bits
Critical Appliances
Provides a table of configured appliances that are currently in a Critical state. The table lists the appliance name, appliance type, hardware model, software version, site, and group.
About the Data Insights Dashboard
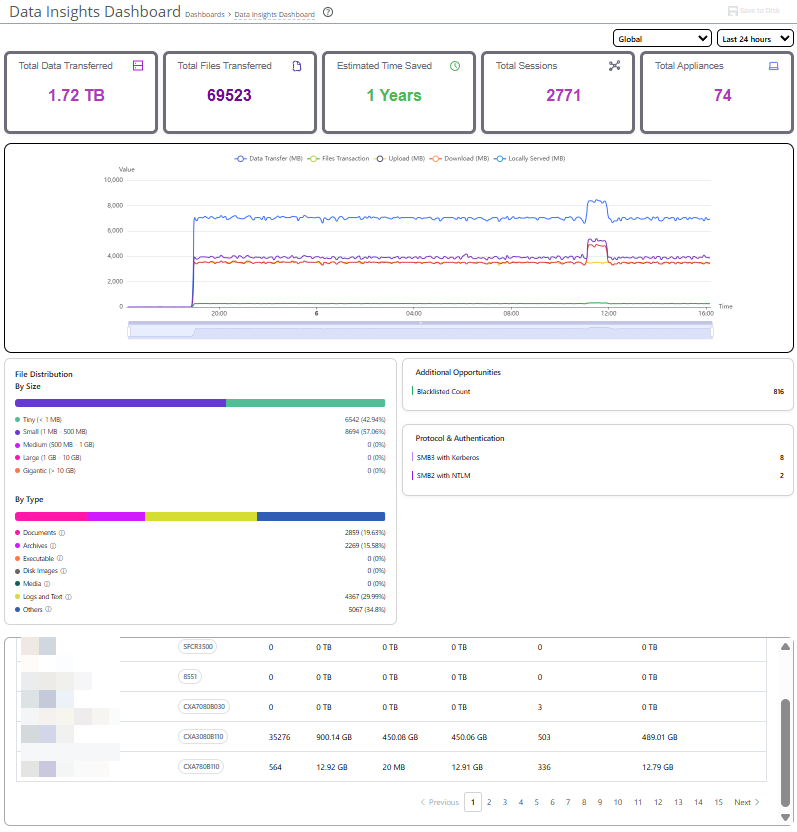
The Data Insights Dashboard is located under Dashboards > Data Insights Dashboard. This outcome-based dashboard aggregates and visualizes performance metrics for SMB file transfers. It displays the number, size range and type of files transmitted, LAN data transferred, and estimated time saved through optimization. It also displays the Blacklisted Count and the Kerberos and NTLM authentication count. You can customize the report to show specific time periods.
Data Insights Dashboard
Viewing managed appliance status
You can view appliance status under Reports > Topology: Appliance Status.
A global summary displays quick status information about all managed appliances, including the number of managed appliances by product type, appliance health and connection status, and the total number of connections handled by SteelHeads. Health and connection status can be in one of these states:
• Healthy—The appliance is functioning and optimizing traffic.
• Needs Attention—Accompanies a healthy state to indicate management-related issues not affecting the ability of the appliance to optimize traffic.
• Degraded—The appliance is optimizing traffic but the system has detected an issue.
• Admission Control—The appliance is optimizing traffic but has reached its connection limit.
• Critical—The appliance might or might not be optimizing traffic; you must address a critical issue.
• Connected—The appliance is connected to the controller.
• Disconnected—The appliance isn’t connected to the controller. A reason, if known, is listed.
• Unsupported—The appliance is connected but not supported by the controller.
Below the global summary, you’ll find more detailed information about managed appliances. Settings enable you to configure which pieces of data are displayed in the tables under the other tabs. Global options settings specify the time period and application traffic direction (bidirectional, or one way) for data under Reduction and Peak Throughput columns. While most items are self-explanatory, here are some things to note about specific pieces of data:
• Status—Displays the overall status of the appliance. The message from the most severely triggered alarm is displayed. If there are two equally severe alarms being triggered, the newer alarm is listed here.
• Reduction—Displays the total decrease of data transmitted over the WAN, according to this calculation: (Data In – Data Out) and (Data In) *100.
• Total Connections—Displays the total connections (optimized and pass through) handled by SteelHeads.
You can further customize displayed data by group.
About running and saved configurations
When you make changes and apply them, the controller updates the running configuration. These changes, however, are not yet saved to disk and will be lost if the appliance is rebooted. You must save your changes to disk for them to persist. You can save multiple different named configurations.
About help
Context-sensitive help is provided for most GUI pages. Just click the question mark next to the page title. You can also access the help from the link on the Help page. The Help page also provides you with the contact information for Support; details about the controller appliance, including the model number, hardware revision type, serial number, and software version number currently installed on the appliance; and access to Riverbed and product MIB files.
About best practices
Use these best practices when working with SCC. For best practices related to earlier versions, refer to the documentation specific to those releases.
Scaling managed appliances
The physical model 1000 SCC can manage up to 2500 appliances. The SCC virtual appliance configuration must be equivalent, or better, to the model 1000 to support 2500 appliances.
Adhere to these guidelines for deployments with 1500 or more appliances:
• Legacy (RiOS v8.x and prior) policy pushes must be limited to 200 appliance at a time. This process may take several minutes for a larger set of appliances.
• Hybrid network policy pushes are limited to 500 appliances at a time. This process may take several minutes for a larger set of appliances.
• If a legacy and hybrid networking policy push must be performed together, then the push is limited to 200 appliances at a time. This process may take several minutes for a larger set of appliances.
• When upgrading large deployments, the initial upgrade may take several hours.
• If your deployment contains more than 1000 appliances, backups will take more than three hours.
Latency detection
When peer SteelHead appliances are geographically close — such as in full-mesh topologies — network latency can be very low. In these cases, simply passing traffic through may be faster than optimizing it.
Previously, you had to manually create in-path rules for each connection you wanted to bypass optimization, which was difficult in large networks. Now, latency detection policies let you globally control whether peer SteelHeads pass through or optimize traffic based on latency. You can still override this behavior for specific connections by creating an in-path rule and selecting the option to ignore latency detection.
Peering mode for client authentication
Peering mode for client authentication can be configured in the GUI. When using peering mode client authentication, the SteelHead acts as a trusted “man‑in-the-middle.” When a client certificate request arrives from the server:
1. The server-side SteelHead replies to server’s client certificate request with its own peering certificate.
2. The client-side SteelHead requests a client certificate in response to the client hello.
3. The client-side SteelHead authenticates the client certificate using the existing trusted CA repository.
This mode supports the Ephemeral Diffie-Hellman key exchange.
When upgrading to SCC 9.9, the client authentication setting of any appliance managed by SCC will be overwritten.
Riverbed software image verification
Riverbed software images are now digitally signed, ensuring the integrity and authenticity of the image. Verifying an image is performed by comparing a public key, or image signing certificate, with the image signature. Image verification is enabled by default. We strongly recommend that it remain enabled at all times. Disable this feature only when absolutely necessary.
Enhanced host proxy settings
You can configure proxy addresses for web or FTP proxy access to managed SteelHead appliances. Additionally, you can create a whitelist of domains to allow direct SteelHead to SCC communication.