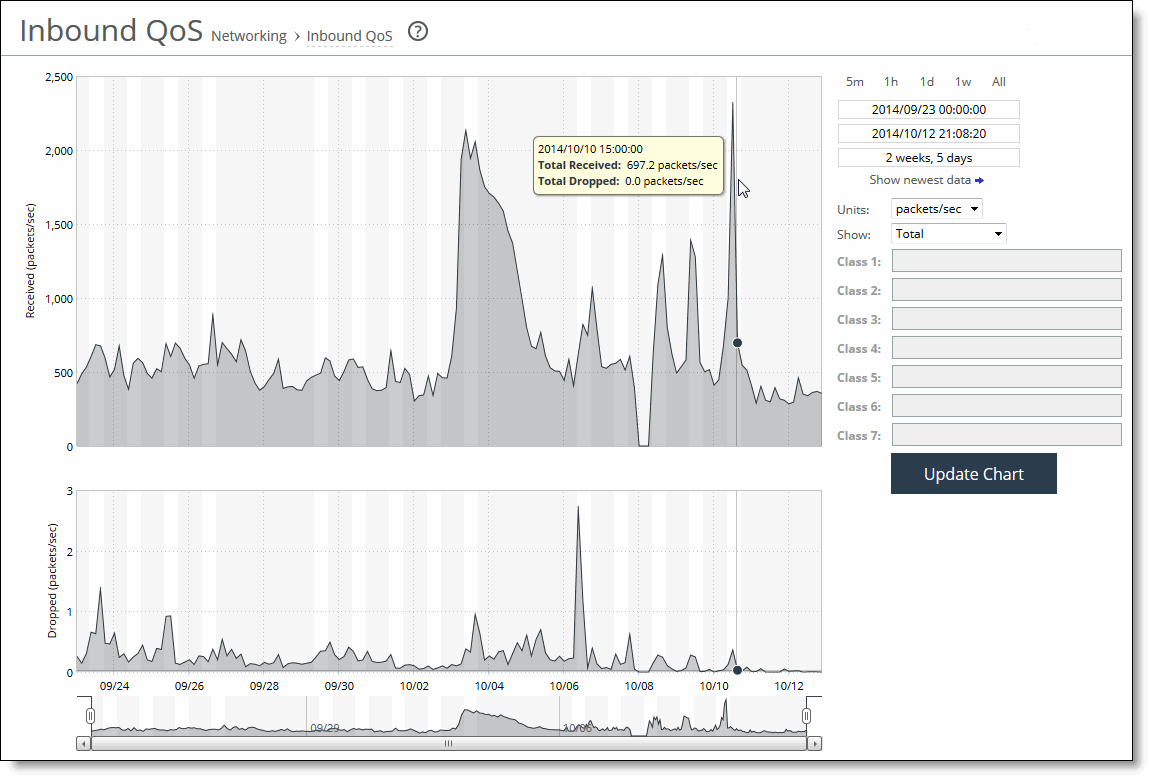
Inbound QoS page


Control | Description |
Time interval | Select a report time interval of 5 minutes (5m), 1 hour (1h), 1 day (1d), 1 week (1w), All, or type a custom date. All includes statistics for the last 30 days. Time intervals that don’t apply to a particular report are dimmed. For a custom time interval, enter the start time and end time using the format YYYY/MM/DD HH:MM:SS. Because the system aggregates data on the hour, request hourly time intervals. For example, setting a time interval to 08:30:00 to 09:30:00 from 2 days ago doesn’t create a data display, whereas setting a time interval to 08:00:00 to 09:00:00 from 2 days ago will display data. When you request a custom time interval to view data beyond the aggregated granularity, the data is not visible because the system is no longer storing the data. For example, these custom time intervals don’t return data because the system automatically aggregates data older than 7 days into 2-hour data points: • Setting a 1-hour time period that occurred 2 weeks ago. • Setting a 75-minute time period that occurred more than 1 week ago. You can view the newest data and see data points as they’re added to the chart dynamically. To display the newest data, click Show newest data. |
Units | Select either packets/sec or bps from the drop-down list. |
Classes | Select Total or Selected classes from the drop-down list. Selected classes lets you narrow the report by choosing from drop-down lists of classes and remote sites (up to seven). You can’t select a class or a class @ site more than once. Click Update to change the QoS class selection without updating the chart. When the report display includes the total classes, the data series appear as translucent; selected classes appear as opaque. When the report display includes the total classes, the navigator shadows the total received series. When the report display includes selected classes, the navigator shadows the first nonempty received series. A data series can be empty if you create a QoS class but it has not seen any traffic yet. Selecting a parent class displays its child classes. For example, the report for an HTTP class with two child classes named WebApp1 and WebApp2 displays statistics for HTTP, WebApp1, and WebApp2. When a selected class has descendant classes, the report aggregates the statistics for the entire tree of classes. It displays the aggregated tree statistics as belonging to the selected class. |