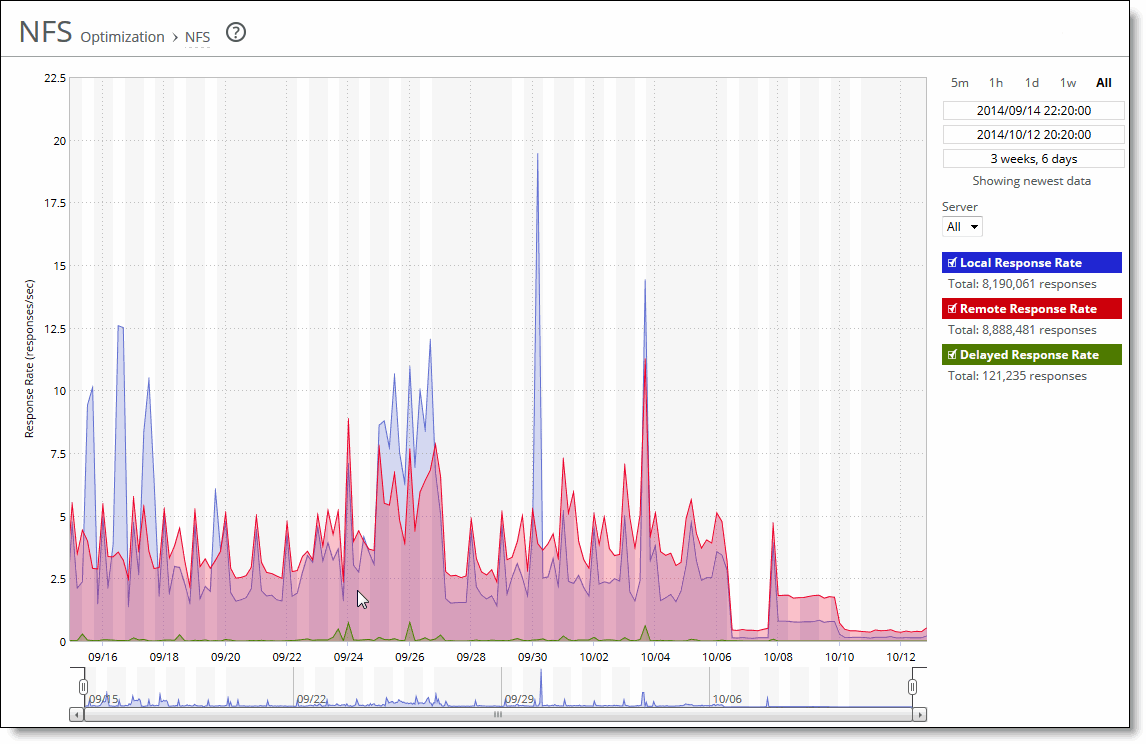
NFS page

Data series | Description |
Local Response Rate | Displays the number of NFS calls that were responded to locally. |
Remote Response Rate | Displays the number of NFS calls that were responded to remotely (that is, calls that traversed the WAN to the NFS server). |
Delayed Response Rate | Displays the delayed calls that were responded to locally but not immediately (for example, reads that were delayed while a read ahead was occurring and that were responded to from the data in the read ahead). |

Control | Description |
Time interval | Select a report time interval of 5 minutes (5m), 1 hour (1h), 1 day (1d), 1 week (1w), All, or type a custom date. All includes statistics for the last 30 days. Time intervals that don’t apply to a particular report are dimmed. For a custom time interval, enter the start time and end time using the format YYYY/MM/DD HH:MM:SS. You can view the newest data and see data points as they’re added to the chart dynamically. To display the newest data, click Show newest data. |