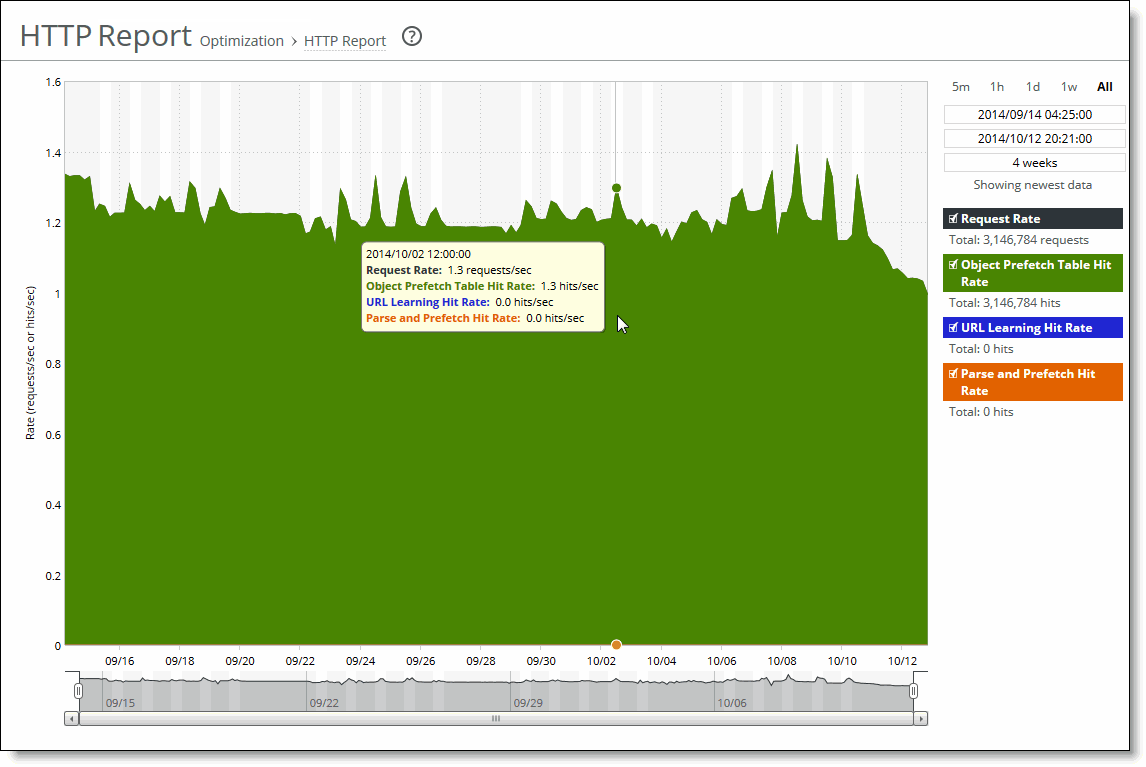
HTTP Report page

Data series | Description |
Request Rate | Select to display the rate of HTTP objects, URLs, and object prefetch requests. |
Object Prefetch Table Hit Rate | Select to display the hit rate of stored object prefetches per second. The SteelHead stores object prefetches from HTTP GET requests for cascading style sheets, static images, and Java scripts in the Object Prefetch Table. |
URL Learning Hit Rate | Select to display the hit rate of found base requests and follow-on requests per second. The SteelHead learns associations between a base request and a follow-on request. Instead of saving each object transaction, the SteelHead saves only the request URL of object transactions in a Knowledge Base and then generates related transactions from the list. |
Parse and Prefetch Hit Rate | Select to display the hit rate of found and prefetched embedded objects per second. The SteelHead determines which objects are going to be requested for a given web page and prefetches them so that they’re readily available when the client makes its requests. |

Control Panel | Description |
Time interval | Select a report time interval of 5 minutes (5m), 1 hour (1h), 1 day (1d), 1 week (1w), All, or type a custom date. All includes statistics for the last 30 days. Time intervals that don’t apply to a particular report are dimmed. For a custom time interval, enter the start time and end time using the format YYYY/MM/DD HH:MM:SS. You can view the newest data and see data points as they’re added to the chart dynamically. To display the newest data, click Show newest data. |