Deployments on Scale
This chapter provides several best practices to deploy NetIM on scale, including:
• Distribute resources in multiple geographic regions.
• Tune your implementations.
• When possible, troubleshoot the topology inference capability.
• When possible, troubleshoot SNMP and WMI performance metrics polling.
• Right size to avoid system resource issues.
Deployment in multiple geographic regions
For network environment infrastructure that spans multiple geographic regions (GEOs), the deployment strategy for NetIM varies from a single instance. Geographic distribution is a consideration for data collection and use of NetIM.
Geographic dispersion of network devices introduces additional factors. The most common factors in determining the number of NetIM instances and deployment size are:
• Hours of operation(s)
• Wide area network (WAN) forwarding delay or latency
• The data rate of WAN resources (link speeds, provisioning, transport, latency, and so on)
• Density and number of network devices (network population)
Hours of operation
When operations are continuous (24x7) and systems are accessed from multiple points, deployment of NetIM per region (GEO, principality, country, and so on) provides a more localized system. Where other regions access extra-regional instances, the NetIM systems can be configured and tuned to provide consistent access and performance. One such method is described in the “Supplemental scheduled jobs” section below.
Wide area networks
WANs can have variations in performance that impact data collection. Regional data collection can help manage the variations. NetIM scheduled jobs can be adjusted to accommodate the need for longer timeout values or collection retries due to failure or delay. This adjustment is more common in satellite-based WAN connections. Placing a NetIM instance closer to the network devices, interspersed between regions segregated by long-haul WAN, improves the manageability of data collection.
WAN data rates
In cases where WAN connectivity is lower bandwidth and higher latency, the network can be supported using polling profiles adjusted to suit the constraints of the network. After initial discovery and polling, the network devices can be classified by polling duration. This classification allows the devices to be separated into groups based on polling duration. The groups can then be assigned individual polling profiles suitable for their average response time and polling duration.
Implementation tuning
The specifications in the Alluvio NetIM System and Deployment Requirements Guide provide a baseline for NetIM deployment. As the deployment matures or scope increases, the systems may require adjustment or tuning to continue providing optimum performance. The goal in tuning a NetIM deployment is to enhance the completeness of operation, correctness and consistency of configuration, and reliable operation.
The areas of NetIM where configuration refinement (tuning) improves performance commonly include system resources, distribution of processing workload, and meaningful organization of the collected data.
Validation of VM provisioning
Correct allocation, reservation, priority, and performance of host system and storage resources are components integral to NetIM performance. NetIM relies on rapid communication between its member systems (swarm) to execute functions. Inadequate resources can induce system performance degradation. Non-reserved resources can produce a similar effect where delay in allocation at the host level occurs.
Initial allocation of resources occurs during the deployment of the systems. The resources are specified as part of the virtual appliance image(s). After the initial deployment, the same resources should be reserved at the host level.
Using ESXi as an example, the fields to reserve resources are in the VM settings. The values used in the reservation fields should follow the Deployment Guidelines table in the Alluvio NetIM System and Deployment Requirements Guide.
Master Schedule job runtime
The Master Schedule job is scheduled to run once per day by default. The Master Schedule job in its default configuration performs data collection, maintenance, topology inference, and other functions.
As a NetIM deployment increases in size and scope, the length of time to execute the Master Schedule job increases. In extreme cases, the volume of primary data collection, parsing, and import can induce a significant load on the NetIM Core and Workers. The duration of the Master Schedule job should be monitored for duration and impact. The statistics for the duration of the jobs are contained in the service logs and require some analysis. The analysis includes the operations of multiple service components of the Master Schedule Job.
Supplemental scheduled jobs
Additional jobs can be added to provide specific functions. The jobs can be scheduled to operate automatically or unscheduled. Unscheduled jobs are initiated manually using the Run button for a respective entry in the Scheduled Jobs table.
Primary (configuration) data collection
The primary data collection load can be distributed by adding and configuring supplemental scheduled jobs. The supplemental jobs allow primary data collection (configuration from the command line, WMI, and SNMP —separate from metric polling) to be scheduled to provide incremental network device configuration data resulting in a lower impact on networks and network devices.
This method of incremental collection uses supplemental scheduled jobs and automated grouping rules.
The Grouping Rules capability provides a method to organize device information into Groups. The groups can be used to define the scope of scheduled jobs. Combining the scheduled job(s) and grouping enables the scheduling of primary (configuration) data collection. Using this method, the primary data collection load can be distributed or segmented. The specific method and schedule may vary. General use would employ groups to define scope for jobs, scheduling to define the starting time of job runs, and selection of job functions providing options to manage job actions or duration.
Grouping Rules can utilize a wide variety of information to organize device data. Each type of data can also be matched or excluded based on rule logic or regular expressions. A NetIM system can support multiple rules determined by the organizational requirements, integration with other Riverbed products, or other management criteria.
This example is a rule that creates a group for devices that have the state of New York, USA, in their location data as determined by the Scope filter. The rule is also selected to run with the scheduled job to maintain the group membership. The overwrite option clears the group with each rule execution.
NetIM Rules Configuration (_Data_Collection_A) Example
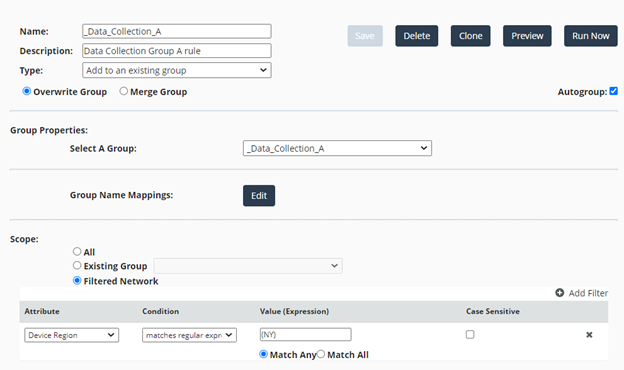
The group created by the rule is then used to scope the activity of a supplemental job. Multiple jobs can be added and scheduled, and the functions of a job can be enabled or disabled according to the required functions.
This job list includes the Master Schedule as well as supplemental jobs dividing data collection into five separate times and two separate jobs for device access maintenance.
In the example the collection of configuration data is distributed over a longer time frame per day. Additional settings in each job select the needed functions.
This example shows the basic settings of one supplemental job. The active state, schedule, time zone, recurrence, frequency, and scope (Group) are noted.
NetIM Basic Settings of One Supplemental Job
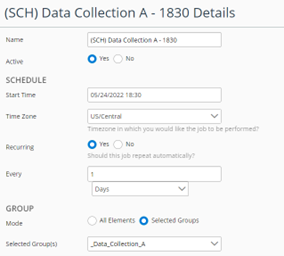
Data Collection is enabled with lower concurrent connections for the command-line interface (CLI) and SNMP. The default number of concurrent connections is 200. In this case, the number of connections is lowered to 50. This value imposes less load on the network (lower operating silhouette) and provides adequate connections to the target devices.
The job also has Pre-Collected Files set as inactive, Data Import is enabled, Auto Group is disabled (this runs under the Master Schedule), and Topology Inference is disabled (this runs under the Master Schedule).
The result is that the same daily data collection is completed while distributing the activity across a broader time frame.
Bear in mind this method manages network device command line and SNMP configuration data. SNMP polling for metric collection is managed separately using polling profiles.
In summary, this example collects configuration data from a subset of network devices while being scheduled to occur before the Master Schedule. No discovery or access configuration testing is done. The data is imported but topology inference is performed by the Master Schedule job.
This approach can be used to distribute and schedule job functions to meet scheduling, geographic, or other operational requirements.
Device discovery troubleshooting
For NetIM to discover a device, it must be SNMP accessible and must respond to SNMP ping as defined in NetIM.
The ping response must include:
• sysname*
• fnumber*
• sysuptime (optional for core-side device discovery but required for poller discovery)
If the device responds to the ping, additional information about the node is collected to create a lightweight model that contains system, interfaces, memory, and CPU information.
Common causes of SNMP discovery issues
• Lack of SNMP Credentials in NetIM Global Discovery Settings.
• A device does not respond to SNMP ping but is otherwise accessible via SNMP. This behavior is usually caused by firewalls or some routing device with special security features enabled.
• An access control list is blocking SNMP access.
• The customer device has SNMP View-based Access Control configured.
• The customer device was merged with another customer device in NetIM based on IP matches.
• Some NetIM processes are queued, blocking further device discovery attempts.
• The device you want to discover is configured for an AES 256 encryption algorithm incompatible with NetIM.
If the device responds to the ping, additional information about the node is collected to create a lightweight model containing system, interfaces, memory, and CPU information.
Validation of initial SNMP discovery results
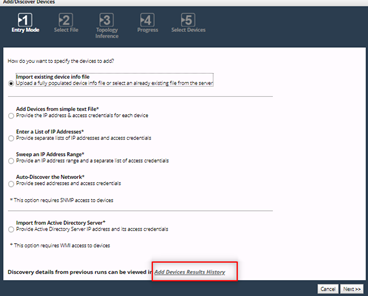
This section details how to access the discovery results reports, which generates each time the discovery process runs. Use this report to identify the reasons for the polling failure. This report informs how you proceed to the rest of the steps noted in this section.
1. Log in to NetIM and check the Add Device Discovery Results History report under Configure > All Settings > (Discover) Add/Discover Devices for failure reasons.
2. Click the Add Device Result History hyperlink in the wizard to launch the report.
NetIM Add/Discover Devices Wizard - Add Device Result History Hyperlink
3. Select the report that corresponds with the date and time discovery was attempted on the device.
4. The report's results show a detailed view of the devices during that discovery attempt.
NetIM Add Devices Results Window
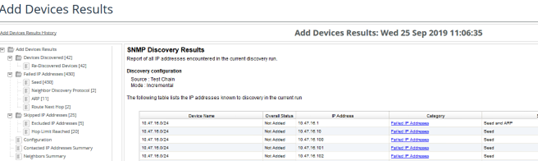
Did discovery fail, or was the device merged with an existing device? If so, check these:
• Check SNMP access to the device you want to discover by using the MIB Browser Utility.
• Does the device you want to discover respond to a request for “sysname” “if number” and “sysuptime”?
If the device is accessible and you have confirmed that the device requires SNMP Object Identifiers (OIDs), enable debug on the Adapter Server Process and rediscover the device.
Enable Debug on the Adapter Server
1. Log in to NetIM and choose Configure > All Settings.
2. Under Administer, select Core Server Management.
3. Under Debug Settings, set Debug State for Riverbed Adapter Service to On and Set Debug Level to 6.
4. Click Submit.
5. Check the AdapterServer log under <install_dir>/log for the detailed debug logging. You will see messages similar to these:
2019/09/25 22:19:14 - INFO [SnmpDiscoveryPing.ping,Node : 10.47.17.16 does not have SNMP Version
2019/09/25 22:19:14 - INFO [SnmpDiscoveryPing.pingNodeWithOutVersion,Node : 10.47.17.16. Trying DPI Credentials first
2019/09/25 22:19:14 - INFO [USMCredentialsMgr.tryV3Credentials,Node : 10.47.17.16. Trying Global V3 Credentials
2019/09/25 22:19:14 - INFO [QueuedPushSupplierImpl$PushDaemon.pushEventsInQueue(),[Device Discovery:Evt-680]
2019/09/25 22:19:14 - INFO [CommunityStringPriorityQueue.tryV2Credentials,Node : 10.47.17.16. Trying Global V2 Credentials
2019/09/25 22:19:14 - INFO [SnmpPollingRouter.guessVersion,Trying version : 1
2019/09/25 22:19:14 - INFO [QueuedPushSupplierImpl$PushDaemon.pushEventsInQueue(),starting to deque: Wed Sep 25 22:19:14 EDT 2019
2019/09/25 22:19:14 - INFO [SAXConfigReader.addConfigFile,Missing file: /lib/xml/res/SNMPOIDCodeCoverage.res
2019/09/25 22:19:14 - INFO [SnmpAsynchTaskThread.sendPDU,sendId : 280 , packet size sending : 83
2019/09/25 22:19:14 - INFO [SnmpAsynchTaskThread.callback,requestId : 280 , packet size received : 128
2019/09/25 22:19:14 - INFO [SnmpPrettyPrint.printString,The mibOps (toString) : sysName.0:-->BETH-CS-MET01.nclab.nbttech.com
2019/09/25 22:19:14 - INFO [SnmpPrettyPrint.printString,The mibOps (toString) : sysName.0:-->BETH-CS-MET01.nclab.nbttech.com
2019/09/25 22:19:14 - INFO [SnmpPollingRouter.getSysNameAndOtherDetails,Found one of the versions to be working for BETH-CS-MET01.nclab.nbttech.com
2019/09/25 22:19:14 - INFO [SnmpPrettyPrint.printString,The mibOps (toString) : sysName.0:-->BETH-CS-MET01.nclab.nbttech.com
2019/09/25 22:19:14 - INFO [SnmpPollingRouter.setSysName, set sysName to BETH-CS-MET01.nclab.nbttech.com
2019/09/25 22:19:14 - INFO [SnmpPollingRouter.setIfNumber, set ifNumber to 12
Preventing devices from merging during discovery
Devices merge if 80% of their IP addresses match a previously discovered device. NetIM considers a device that matches while merging the same device. Therefore, there is no need to add them to its device management information records again.
The information used to determine which access address to set and if there are common addresses for merging is contained in this file:
<install_dir>/log/errorLogs/Device Discovery/Device and Platform Info Auto Discovery/debug/orderedIPs.txt
The Equivalent IP Addresses example below shows the addresses discovered in the devices ipAddrTable. Valid IP Addresses/Ordered IP’s are the accessible addresses that could be used as potential access addresses. The order for accessing addresses selection is Loopback, Highest, and Lowest. If a device has many equivalent IP addresses that match, it can merge them.
Printing Addresses for Node : BETH-CS-MET01.nclab.nbttech.com( Device ID :1626833899430)
IP Address Table Collection Status (Complete, Empty)
s:1626833899430 ---> (true,false)
Access IP Addresses for Node : BETH-CS-MET01.nclab.nbttech.com, Count : 1
a:1626833899430 ---> 10.47.17.16
Equivalent IP Addresses for Node : BETH-CS-MET01.nclab.nbttech.com, Count : 6
e:1626833899430 ---> 10.1.128.14
e:1626833899430 ---> 10.2.10.2
e:1626833899430 ---> 10.44.133.81
e:1626833899430 ---> 10.47.17.16
e:1626833899430 ---> 192.168.90.1
e:1626833899430 ---> 192.168.100.1
Valid IP Addresses for Node : BETH-CS-MET01.nclab.nbttech.com, Count : 3
o:1626833899430 ---> 10.47.17.16
o:1626833899430 ---> 10.1.128.14
o:1626833899430 ---> 10.2.10.2
To prevent merging, all identified matching equivalent addresses can be added to "<install_dir>/input/AutoDiscovery/excludeFromDpiSelection.txt".
## Addresses specified in this file will not be chosen as an access address for
## a device during Device Discovery.
## Format :
## IP addresses and subnets should be defined in a single line.
## To specify an IP address to be excluded:
## xxx.xxx.xxx.xxx, e.g.:- 192.168.1.1
## To specify a subnet to be excluded:
## xxx.xxx.xxx.xxx/yy, e.g. :- this excludes all IP addresses from 192.168.1.1 to 192.168.1.255
## 192.168.1.1/24
## Additionally, you can also specify ranges of IP Aaddresses to be excluded:
## xxx.xxx.xxx.xxx-xxx, e.g.:- 192.168.1.1-5 excludes all IP Addresses from 192.168.1.1 to 192.168.1.5
## By default, we exclude the loop back addresses and all destination address (0.0.0.0)
127.0.0.0/8
0.0.0.0
An alternate solution would be to delete the contents of orderedIP.txt and rediscover the specific devices that were merged. Do not include the device that is getting merged within the rediscovery attempts, or the merge occurs again.
Other key discovery files are found in these locations as well:
File | Directory Path |
Autodiscovery Configuration | <install_dir>/input/AutoDiscovery |
Device Discovery Logs | <install_dir>/log/errorLogs/Device Discovery/ |
Device data collection validation
Data collection is how NetIM collects command-line interface (CLI), SNMP, WMI-based configuration, and operational data from devices. This information is used to create a virtual representation (a model) of the device in the NetIM database. This model contains the information necessary to build a fully connected virtual network topology.
NetIM models include:
• Routing and switching protocols
• Access control lists
• Interface configurations
• Firewall policies
• Routing policies
• Operational routes
• Neighbors protocol operational data and more
Common device data collection issues
• CLI and SNMP access credentials are not set.
• The device entry is not active or does not have CLI or SNMP access enabled.
• The device is not allowing SNMP access or unknown SNMP credentials.
• The user account used for CLI access does not have command authorization to perform show commands.
• The CLI session is stalling, or SNMP data collection is timing out.
• If TACACS+ is being used for device authentication, NetIM may be creating too many connections. TACACS+ blocks these excess connections leading to login failures.
• TACACS+ server timeout on the devices is too low.
• NetIM was not able to set the correct device driver, and autoconfig failed. NetIM parses the OS type from the sysdescr OID (SNMP) and show version (CLI), and this information sometimes does not match what NetIM expects.
How does data collection work?
• NetIM runs schedule jobs that perform discovery and auto-configuration of the discovered device.
• This discovery phase sets the SNMP and CLI access credentials needed to collect SNMP and CLI commands data to build the device model.
• CLI commands are collected and archived, the relevant command lines are parsed, and the resulting XML data is imported to supplement the basic model.
• SNMP command data is collected to refine the model further.
• Many CLI commands and SNMP provide some of the same data; therefore, NetIM merges and overwrites information as required.
• The first collection is run in Greenfield mode. Subsequent collections are running in optimized mode. In this mode, NetIM performs file difference, and only the changes from device CLI and SNMP data are imported. This optimization strategy drastically speeds up subsequent model refreshes.
• The richest set of model data is consumed by external clients such as NetPlanner, NetAuditor, and Modeler. A minimal model data set is visible in the NetIM UI and Portal.
Common causes of model fidelity issues
• The device isn’t responding to all the OID’s NetIM need to model the device.
• OID is either blocked or not supported.
• The device is sending SNMP protocol data unit (PDU) responses, not in the requested order.
• The command-line output is invalid or contains no information.
• Lines from the command-line output are not getting parsed.
• Lines in the command-line output and SNMP config data are getting parsed but not modeled in the NetIM database.
• The collected data was extensive, and NetIM skips import of it.
How do I validate the collected model data?
Command-line interface
Check the Collected Files view to ensure that all files are collected.
Check data1/riverbed/NetIM/op_admin/tmp/vne/XML for XML generated from parsed CLI data.
• xml_opt files are the parsed files of the difference detected.
• xml.IMPORTED files are the XML results from the full files.
Check <install_dir>/log/AdapterLogs. These logs show the line skipped from the CLI output files. If you note a config line that the client claims Riverbed should be parsing, then the command line might have changed and NetIM needs to be updated to parse the new command.
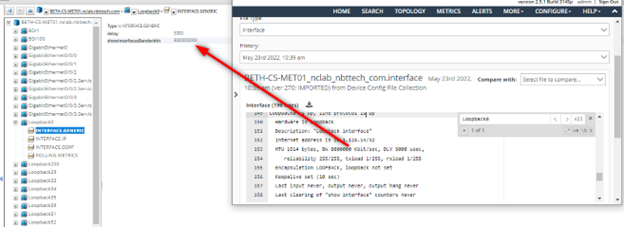
Check the legacy network browser to see if command-line data is modeled:
https://<server_name>:8543/vnes/Legacy.html
Example of Collected Config Command Line vs Modeled Configuration Attribute Comparison
SNMP data
Check data1/Riverbed/NetIM/op_admin/tmp/vne/Device_MIB_Collection
• mib_xml_opt the parsed files of the differences detected.
• mib_xml.USED the XML results from the collected mib data files.
See the example below.
If key data is missing from the XML, use the MIB Browser to check for the presence of this data on the device. See the example below.
Checking missing data from the mib_xml.USED file
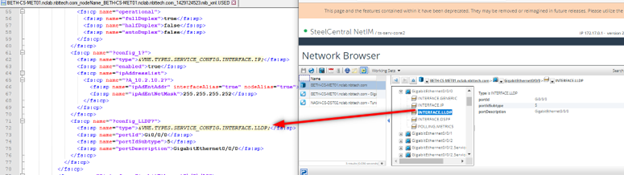
Use the legacy network browser to validate the model.
Increasing the XML import size limit
1. On the core, open the file <install_dir>/lib/xml/dtd/props_amd64.dtd in a text editor.
2. Locate the lines below and increase the value for VNE.TYPES.CATEGORY.DEVICE_TOPOLOGY.MAXIMPORTFILESIZE_IN_MB as needed.
<!-- Set the category based max xml import file size (in MB) -->
<!ENTITY VNE.TYPES.CATEGORY.DEVICE_TOPOLOGY.MAXIMPORTFILESIZE_IN_MB "40">
<!ENTITY VNE.TYPES.CATEGORY.MODELSYNC.MAXIMPORTFILESIZE_IN_MB "20">
3. Restart the NetIM Core services.
Increasing the XML worker memory size
1. On the core, open the file <install_dir>/lib/xml/res/processes.res in a text editor.
2. Locate the section that starts with this line:
<!-- The Parallel XML Import Processes -->
3. Locate the java options here:
&VNE.SERVICE.NETWORK_MODEL_DATABASE_SERVER.NAME;.hprof -Xmx720m -Xms30m -Djava.awt.headless=true -Dcom.opnet.service.name=
4. Increase the Xmx value as needed and restart the NetIM Core services.
5. Increasing the max import files size and max heap (Xmx) can increase schedule run times and the amount and the memory requirements for Adapter Server and Network Model Data Service. The memory allocation for these services may need to be made as well. These settings can be made by adjusting the memory slider on the Core Server Management page: Configure > All Settings > (Administer) Core Server Management.
6. If the memory slider has already adjusted as far to the right as possible, and the Adapter Server or Network Model Database Service is running out of memory, you can also change these settings directly on the file system.
7. On the core, open the file <install_dir>/services/conf/wrapper_amd64.conf in a text editor. Locate the config lines that contain the max heap options for Adapter Server and Network Model Database Server.
set.VNES_ADAPTER_SERVER_MAX_HEAP=2056M
set.VNES_NETWORK_MODEL_DATABASE_SERVER_MAX_HEAP=2236M
8. Make adjustments as needed, ensuring that the total memory allocated does not exceed 80% of the installed memory. If you exceed 80%, core services will not start. Suppose the IP Detection, App Path Analysis, Synthetic Testing, and Generic Metrics Import are not used extensively. In that case, you may also consider reallocating some but not all memory from Auxiliary Service or Operational Data Collection Service.
Making memory changes directly to the wrapper_amd64.conf disables the memory slider on the core server management page. If you want to revert the changes made directly to the file and re-enable to the slider, you can run the command app.sh SET_MAX_HEAP_SIZE and restart the core services from its command-line interface.
Data collection logs and reports
If you need to look at the device login and CLI transcripts (failures only), look at this directory:
<install_dir>/log/errorLogs/Device Config File Collection/transcripts/
Transcript logging can be enabled for both successes and failures by enabling it in:
<install_dir>/lib/xml/res/CollectConfigFilesAdapterDev.res
Device MIB Configuration Import Errors Report (cause SNMP Collection failure):
<install dir>/log/errorLogs/Device MIB Configuration Import/errorLog.csv
Device Connection Diagnosis (cause of CLI Connection failure):
<install_dir>/log/errorLogs/Device Discovery/Direct Device Connection Diagnosis/
SNMP Engine ID Report (generated by running the command app.sh ENGINEIDREP):
<install_dir>/log/errorLogs/snmpEngineIDReporter/
Adapter Logs (show command output lines skipped during command parsing):
<install_dir>/log/AdapterLogs.
Live event viewer
NetIM Core contains a legacy graphical console feature that can be launched from the remote desktop or SSH client that contains an X-Windows Server. Run the command app.sh CP to launch it.
Click Event to launch the Event Viewer.
Do not leave this viewer open. It can cause application performance issues.
A summarization of these events is also available from the System Event Dashboard in the NetIM UI. Choose Configure > All Settings > (Administer) System Event Dashboard.
Topology Inference troubleshooting
Topology Inference is how NetIM uses the collected IP address, neighbor protocol, forwarding, routing, and VPN configuration to infer the interconnectivity between devices. The Link and Connection Inference (LCI) adapter process facilitates these inferences, which runs at the end of the scheduled job.
This list provides the connectivity inferred by Link and Connection Inference:
• Physical links (based on physical connectivity data)
• Point-to-point links
• Multipoint links (LAN technologies, clouds)
• Logical connections
• PVCs, MPLS LSPs, tunnels
• Module containment (modules contained in switches)—MSFC, FWSM, RSFC, RSM
• Physical links to realize logical paths
Key points to remember:
• Links created by LCI do not age out.
• Links in the database are cumulative from different runs of LCI.
• LCI can be run on all devices or specified group(s) of devices.
Best practices to solve common topology inference issues
If you have missing links, extra links, and stale links:
• Check Network Model Database Server logs for exceptions while running LCI.
• Verify that information has been collected and the device is fully modeled (collected files, network browser).
• Verify LCI engines are turned ON (choose Configure > All Settings > General Settings).
• Verify that the devices are active in the device manager. (LCI works only on active devices in NetIM.)
• Check what data (or lack of data) is causing the behavior.
• Check how the link was created.
• Try to answer why the link was not created.
• Isolate the issue down to a few devices for troubleshooting. Use the Connection Analyzer tool.
• If the links are connected to interfaces used for management, suppress the link using IP exclusions.
Topology Inference logs and reports
Check these logs if you have link issues:
• Deleted Links Log
<install_dir>/log/LinkInference/Log_last_LCI_run_date_time/deletedLinks.xxxxxx.log
• Merged Links Log
<install_dir>/log/LinkInference/Log_last_LCI_run_date_time/mergedLinks.xxxxxx.log
• Inferred Links Log
<install_dir>/log/LinkInference/Log_last_LCI_run_date_time/inferredLinks.xxxxxx.log
Running the Connection Analyzer
1. From a terminal session on the core appliance, desktop or X-Server-capable SSH client, run app.sh CA.
2. Select the node endpoints that have the incorrect or missing link.
3. Click Analyze.
4. Check the Engine Summary section of the tool to identify which engine generated a connection.
5. Choose View > Engine Details and Merge Details to see the detailed information on why the link is present or not present.
6. If the connection analyzer does not infer a connection, check the devices' operational data to see if there is any information that would show that these devices are connected:
– On the same IP Subnet
– CDP or LLDP neighbors
– MAC address forwarding tables contain entries for the adjacent device
– Logical tunnel configuration
Investigate if this verified data is being collected by NetIM.
Investigate if the data in the table is being parsed and modeled on the device in NetIM. Check the model in the Network Browser.
Engine | Data | Comments |
IP Address Engine | INTERFACE.IP | Interfaces/subinterfaces should be in the same subnet. Check IP subnet report. |
Containment Engine | NODE.CDP or NODE.MODULE | No link created. chassisSysName, chassisObjId are set in NODE.GENERIC. |
Neighbor discovery/LLDP Engine | NODE.CDP NODE.LLDP | Explicit mention of neighbor and interface. |
MAFT Engine | NODE.CAM Interface->physicalAddress INTERFACE.VLAN | The physicalAddress should be seen in the CAM table. |
BGP Engine | NODE.BGP NODE.IP_ROUTING | Inclusion/exclusion list for which ASes to infer. |
PVC Engines | INTERFACE.ATM/FRAME_RELAY | Config file only. |
LSP Engine | NODE.MPLS->lspList | At least the destination should be specified. |
Tunnel engine | INTERFACE.TUNNEL NODE.IP_ROUTING | Config file only. |
General | Interface-> adminStatus, operstatus, ifTYpe, ifSpeed | |
Workarounds for Topology Inference issues
• Suppress the link.
IP exclusions
Configure > All Settings > (Administer) General Settings > Link Inference
MAC address exclusions
Configure > All Settings > (Administer) General Settings > Link Inference
VLAN exclusions
Legacy Advanced Management
Autonomous System (AS) exclusions
Legacy Advanced Management
• Group-based Link Inference can be enabled in cases where the customer has devices on different routing domains that share common IP spaces.
• Create links using bulk import. Links created via bulk import overwrites any existing links with common endpoints. Choose Configure > All Settings > (Customize) Bulk Import.
After applying your workaround, you must delete the current links to remove any incorrect links. Link deletion can be performed from the General Settings page or the command line on the core node. The app.sh CLEAN_LINKS command needs to be run from an RDP session or an SSH client supporting X-Windows Server. See the example below.
Legacy Advanced Management interface
To use the Legacy Advanced Management Interface, go to:
https://<server_address>:8543/vnes/AdvMgmt.html
When attempting to access the Advanced Management screen, a form displays requiring you to enter a valid Support Access Token.
Open a case with Riverbed Support to request a token. After a valid token is entered into the present form and you click Verify Token, you will have full access to the Advanced Management Interface.
Once a valid token is verified within the application, access will be available for one hour. After that time, a new token will need to be obtained.
SNMP and WMI performance metrics polling troubleshooting
What factors can affect polling performance?
• Disk subsystem performance.
• CPU load on the device polled can lead to slow responses to polls.
• Network latency between NetIM and the devices polled. Polling capacity limits are based on a maximum 200 ms latency. If latency is higher than expected, you may require more pollers than what's detailed in the system requirements.
• The bandwidth availability between NetIM and the device polled. If there is Quality of Service (QoS) in place on your network and SNMP is in a low-priority queue, this can lead to increased polling times.
• The number of metrics polled or a large number of polled objects on the device queried (a device with large interface counts).
How does polling work?
• A device gets discovered and modeled by the NetIM Core node.
• Its status is active, a polling profile is assigned, and polling is enabled.
• A subset of the device model and polling configuration pushes to the swarm via the API gateway.
• The polling configuration persists in the configuration repository on the manager node.
• The polling initialization service receives the config change from the configuration service.
• The polling initialization service creates a polling task and sends it to the jobs service.
• The SNMP or WMI Poller service retrieves the polling task from the job services.
• The poller creates or retrieves the pollable object model components from the model components database on the manager.
• Polling start and polled metrics data are sent to the Kafka message bus and stored in a feed/topic.
• A metric writer service subscribes to this feed, consuming the raw metrics data, and then writes this data to Cassandra for long-term storage.
• A metric rollup service also subscribes to the raw data feed; the data is consumed and rolled up, and rolled up data is published back to Kafka to a different feed/topic. The metric writer writes the data from the feed to Cassandra for long-term storage.
• Retrieval of a device's polling status in the NetIM core UI happens via direct API queries of the job service.
NetIM metrics to poll on a device
• The default polling profiles are generic, and all enabled metrics contained in the default polling profile will not work across all device types.
• Devices that support IF-MIB(RFC-2863) and EthernetLike-MIB (RFC 3635) provide interfaces and Ethernet statistics; NetIM attempts to poll regardless of vendor type.
• For WMI polling, NetIM performs a check of the WMI classes during initialization. If a class does not respond during initialization, no polling result requests for that class get sent to that device.
• The polling of other metrics is dependent on specific device sysobjectID to metric class mapping defined in <install_dir>/lib/xml/res/DynamicPollingMIBTable.res and <install_dir>/lib/xml/res/DynamicPollingWmiClasses_dev.res.
Identifying causes of polling problems
• Check the poller and collection status page to identify any failed polls during a polling cycle.
• Errors can occur when one or more fields in the response data from the devices are incomplete, in an unexpected format, or do not match the metric header file. If errors show that the poller “Failed transform result,” this error can lead to the metrics not showing in NetIM. Review SNMP and WMI Poller logs for exceptions and errors.
• The device may not be SNMP or WMI reachable or does not have the correct credentials.
• The device may not be allowing the NetIM worker node SNMP or WMI access.
• If the systems disk subsystem is operating within requirements, check the latency between NetIM and the polled device using ping.
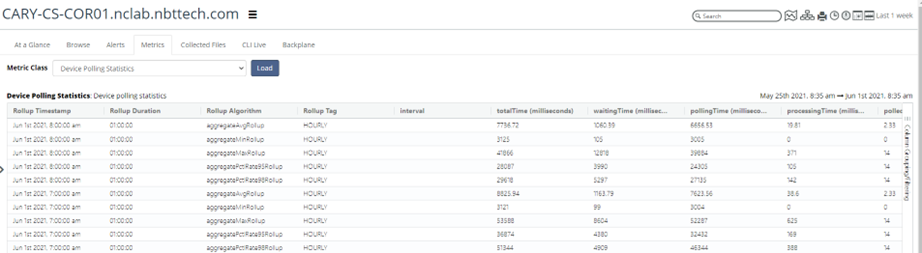
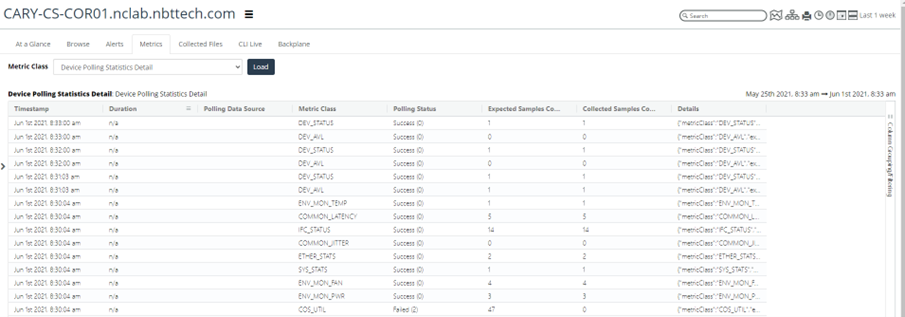
• Check Device Polling Statistics and Device Polling Statistic Detail metrics on the devices. Identify the device where the poll time is close to or exceeds the polling frequency. These devices should be polled less frequently, or the number of metrics reduced.
If you do not see the metric present in Device Polling Statistic Detail:
– There may be no object/component mapping for that metric or an incorrect one.
– The metric is not enabled in the devices assigned polling profile. Check the device Polling Schedule.
– The device is not responding to poller requests for that metric.
See the example below.
Device Polling Statistics
Device Polling Statistics Detail
• Check Poller Status and note any usually high poll times.
• Device Polling Statistics times comprise three categories. These categories provide the total time for NetIM to poll a device and write the data to disk.
– Waiting—The time the poller spends waiting on the polling thread to free up so that it can start polling a device.
– Polling—The time the poller spends from the first request PDU sent to the last Processing time needed to write polling files/messages to Kafka. (This does not include the time persisting metrics data to the Cassandra database.)
– Processing—The time needed to write polling files/messages to Kafka. (This does not include the time persisting metrics data to the Cassandra database.)
• If polls are spending a long time waiting, you can scale polling if there are available workers or add additional workers and then scale:
scale tenant-stack/1 poller <replicas>
• High processing times indicate an issue persisting data to Kafka or insufficient memory on the Manager node. Adding a Data Manager node to scale Kafka would help with this issue.
• Check the Poller Status and note any usually high poll times.
How can I view the polling schedule?
You can check the SNMP poller schedules in detail by logging in to the NetIM UI and accessing this hidden URL:
https://<server_address>:8543/vnes/#/vnes/poller-schedules
NetIM UI Poller Schedules
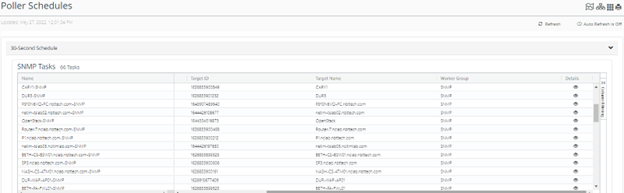
Click the icon under the Details column to view the schedule details.
In the schedule task details window that pops up, you can review the device management details and all the metrics scheduled for polling on the device. You can compare this information to the information set in the polling profile and the device manager to confirm whether the polling configuration was pushed to the job service in the swarm.
Collecting SNMP and WMI polling network traffic using TCP dump
When troubleshooting an SNMP or WMI polling issue, you may need to capture the traffic. Captures should be performed if you contact Riverbed Support. This information helps debug SNMP/WMI connection and SNMP/WMI response issues.
1. Identify the work node where the polling instance polling the device is located. The assigned Worker can be identified from the Poller Status window as shown below.
2. Open an SSH connection to the worker node.
3. Enter these bash commands to access the bash shell:
sudo tcpdump -i ens192 port 161
net <device-access-address> -w /data1/riverbed/<device-name>.pcap
or
sudo tcpdump -i ens192 port 5986
net <device-access-address> -w /data1/riverbed/<device-name>.pcap
Example 1: sudo tcpdump -i ens192 port 161 and net 10.47.17.86 -w /data1/riverbed/test2.pcap
Example 2: sudo tcpdump -i ens192 port 5986 and net 10.47.17.86 -w /data1/riverbed/test2.pcap
4. Wait for two or three polling cycles before stopping the packet capture.
5. If the capture is SNMPv3, you should decrypt the capture. This decryption can be performed in Wireshark using the device's SNMP credentials.
How do I view debug logs for WMI PowerShell CLI?
In addition to the standard logging, if you need to see additional WMI logging information, enable the Debug mode for the PowerShell CLI. In the debug logs, you should see details about the WMI initialization process, the specific WMI commands being called, and potential delays between the command requests and responses.
To view debug logs
1. On the NetIM Manager, open the firewall port for Spring Boot.
2. In the firewall, allow TCP forward 8761.
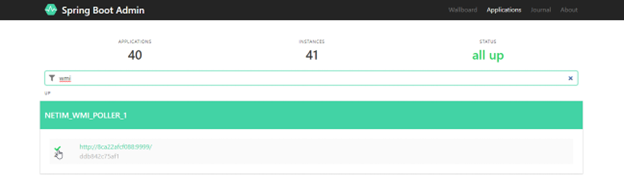
3. In the browser, type http://<Manager IP>:8761.
4. In the search bar, type WMI.
5. Click NETIM_WMI_POLLER_1.
NetIM Spring Boot Window -WMI
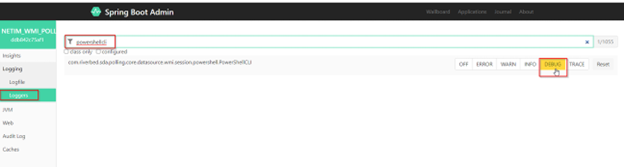
6. On the page, select Loggers under Logging.
7. Type powershellcli.
8. Select DEBUG.
NetIM Spring Boot Window -PowerShell CLI
9. On the Logfile view, you will see debug messages like these:
10. The same steps can be performed to enable debugging on WMI Polling.
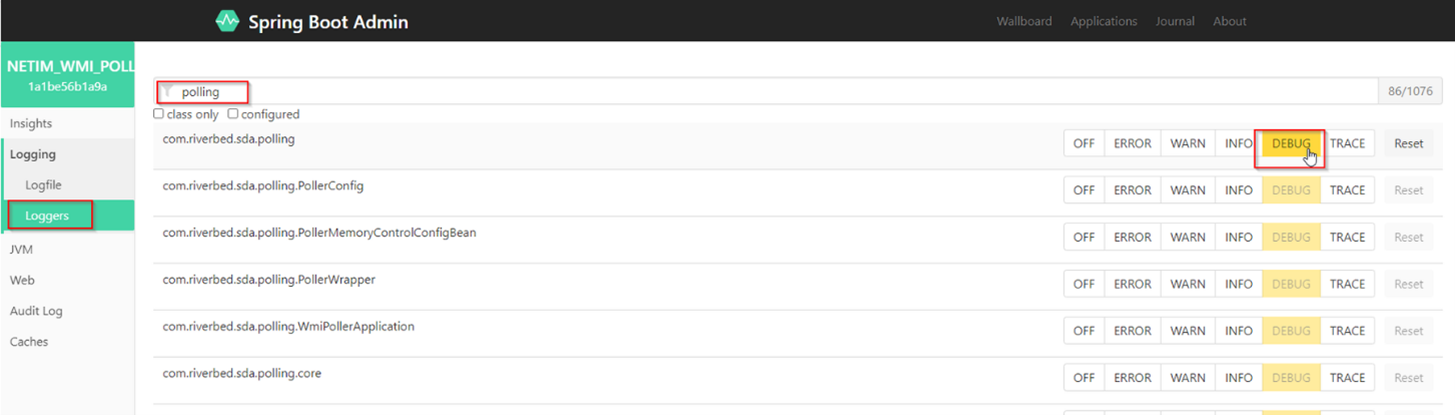
For the WMI Polling:
– Choose Logging > Loggers.
– Type polling.
For com.riverbed.sda.polling, change the setting from INFO to DEBUG. Selecting DEBUG sets all instances under it to DEBUG as follows:
Enable Debugging on WMI Polling
How do I check the component integrity of a device?
A component is a pollable object on a device. Check the integrity of device components if you observe lapses in polling unrelated to the device's lack of reachability.
1. Log into the swarm manager and open firewall 8082.
2. Go to the firewall and allow TCP forward 8082.
3. Open your web browser and go to http://<swarm-manager-ip>:8082/swagger-ui.html.
4. Under rest-model-component-type-controller, find the ID for vnes_oe.
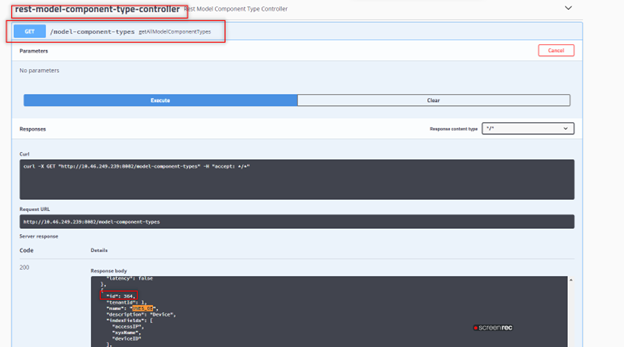
5. Execute GET /model-component-types getAllModelComponentTypes under rest-model-component-type-controller.
6. Search for vnes_oe in the result and find the ID. (In the example below, the ID is 364. Your ID will differ).
7. Use the vnes_oe ID to get the device component list.
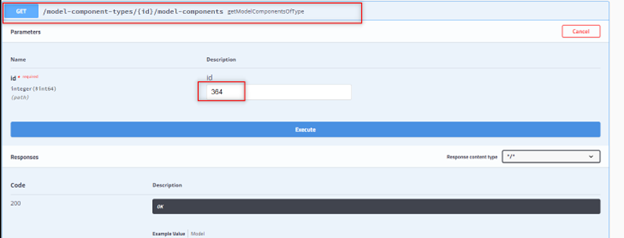
8. Execute GET /model-component-types/{id}/model-components under rest-model-component-controller with ID 364.
Executing GET for Model Component Types verification
Executing GET for Model Component Types verification, Use ID 364
9. Download the JSON file and open it in a text editor. It should include components for all devices.
10. Search for the file for the name of the affected device. This example uses device BETH-CS-MET01. The component ID for this device is 34005.
{
" id":34005,
"modelComponentTypeId": 364,
"fieldsValues":{
"sysName":"BETH-CS-MET01.nclab.nbttech.com",
"sysObjectID":".1.3.6.1.4.1.9.1.1165",
"deviceRebootTime":"1649430068",
"accessIP":"10.47.17.16",
"deviceID":"1626833899430"
},
"modelComponentParentId":null,
"children":null
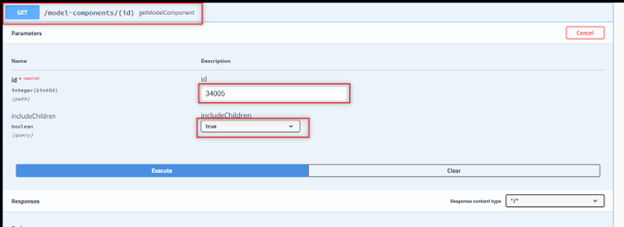
11. Use the devices component ID to retrieve its model components and child components.
Execute GET /model-components/{id} under rest-model-component-controller with ID 34005.
Example of GET with Component ID 34005
12. Download the JSON file and open it in a text editor.
13. Search the file for the metric class that isn't polling. If the metric is present, then polling for it was initialized. This example is for the interface utilization metric class.
{
"id": 36324,
"modelComponentTypeId": 391,
"fieldsValues": {
"metricClass": "IFC_UTIL"
},
"modelComponentParentId": 34005,
"children": null
If there is an issue with some interfaces not polling, search the JSON file for the interface by name. If the interface is present in the file and the metric class, then NetIM has initialized polling on the interface.
Polling initialization does not occur for a metric if the corresponding interface or any other device-level components like CPU, memory, or disk are not present. Perform a packet capture to identify if the device is responding to requests for the metric or use the MIB Browser to query the device to determine if there are any interface or device-level statistics for the failing metric.
If searching the files shows duplicate components, this can lead to metrics not being available in the UI. To clear duplicate components, run these commands from the core node command line to check or delete all duplicates or components from a device.
• Check for duplicate components for the device:
app.sh/app.bat CompService CHECK_DUPLICATE_DEVICE_COMP <DEVICE_NAME | DEVICE ID | ACCESS_IP>
Example: app.sh CompService CHECK_DUPLICATE_DEVICE_COMP BETH-CS-MET01.nclab.nbttech.com
• Delete duplicate components for the device:
app.sh/app.bat CompService DELETE_DUPLICATE_DEVICE_COMP <DEVICE_NAME | DEVICE ID | ACCESS_IP>
Example: app.sh CompService DELETE_DUPLICATE_DEVICE_COMP BETH-CS-MET01.nclab.nbttech.com
• Delete all components for the Device:
app.sh/app.bat CompService DELETE_DEVICE_COMP <DEVICE_NAME | DEVICE ID | ACCESS_IP>
Example: app.sh CompService DELETE _DEVICE_COMP BETH-CS-MET01.nclab.nbttech.com
We strongly recommend that the swarm service be restarted after the components have been deleted. The restart speeds up the update of the component mappings.
Sizing to avoid system resource issues
The function of each Swarm member
Manager
• Point of orchestration control for the swarm.
• Runs critical communication services, such as Kafka, API Gateway, and Service Discovery.
• Runs shared persistence services, such as PostgreSQL and ElasticSearch.
• Runs common application services.
Data Manager
• Runs critical disk I/O-performance-dependent services, such as Cassandra and Kafka.
Worker
• Runs tenant-specific processing application services.
• Services here are intended to be stateless to allow for scalability and fault tolerance.
During deployment of the Swarm Open Virtualization Appliance (OVA), the administrator chooses what role the node being installed into the swarm should have. As described in the system requirements, the number of nodes performing each role varies with the scale of the deployment.
When to add capacity (Data Manager, Worker)
The Alluvio NetIM System and Deployment Requirements Guide document provides the baseline for initial deployment. Often the requirements are adequate for ongoing operation(s). An increase or tuning of resources allows a NetIM deployment to be configured for optimal performance in a wide variety of network sizes, topologies, and types.
Resources
When increasing resources for the NetIM VMs, the performance of the resources is as important as the amount of resources added. If NetIM benefits from reserved resources, in cases of host systems where resource contention may be high, NetIM VMs will have high-priority resources available. An increase from Normal to High (or to a custom value) is most effective for memory and CPU resources.
Data Manager
In addition to scaling considerations related to deployment size, in cases where NetIM will have many concurrent users of the web user interface, NetIM operation can benefit from additional Data Managers. Additional Data Managers can provide scaling support for consistent user interface access. Adding a Data Manager increases the processing capacity of NetIM for database and messaging operations.
Determining the need for additional Data Managers can be assessed through two methods:
1. Changing or increasing user interface response time.
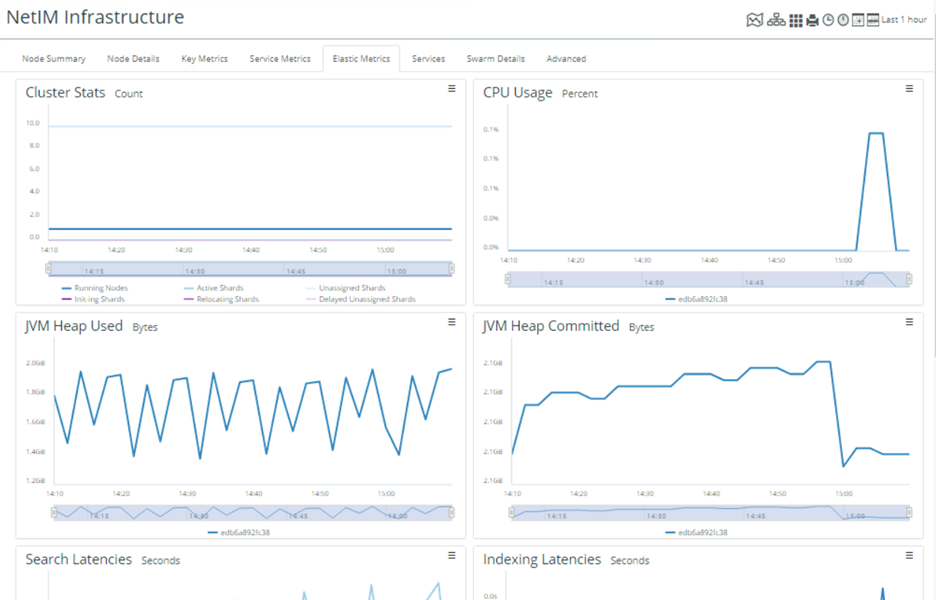
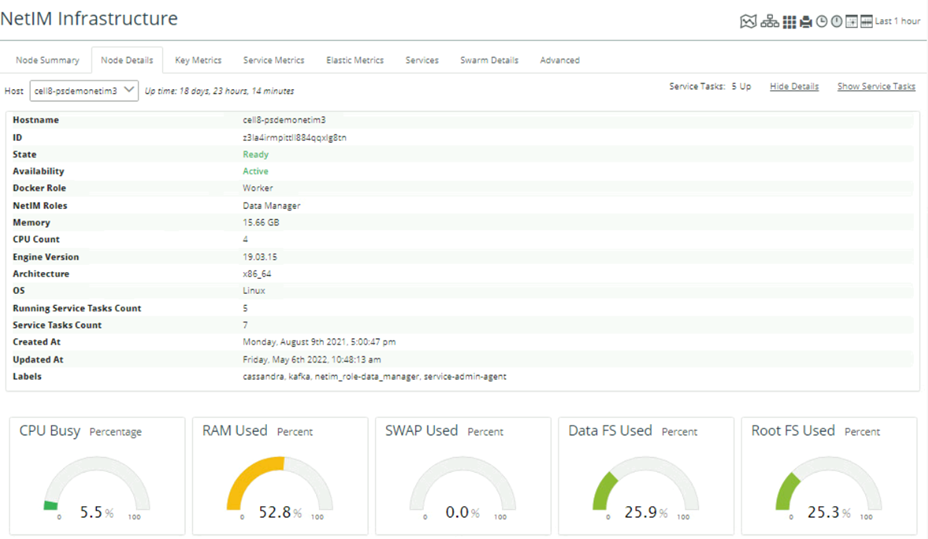
2. Monitoring via NetIM Infrastructure Interface. This portion of the NetIM user interface provides visibility into the operational state of NetIM systems, core services, and swarm services. A review of the status and metrics for the Data Manager(s) in this interface provides insight into any sizing or capacity changes needed.
Monitoring NetIM via Infrastructure Status
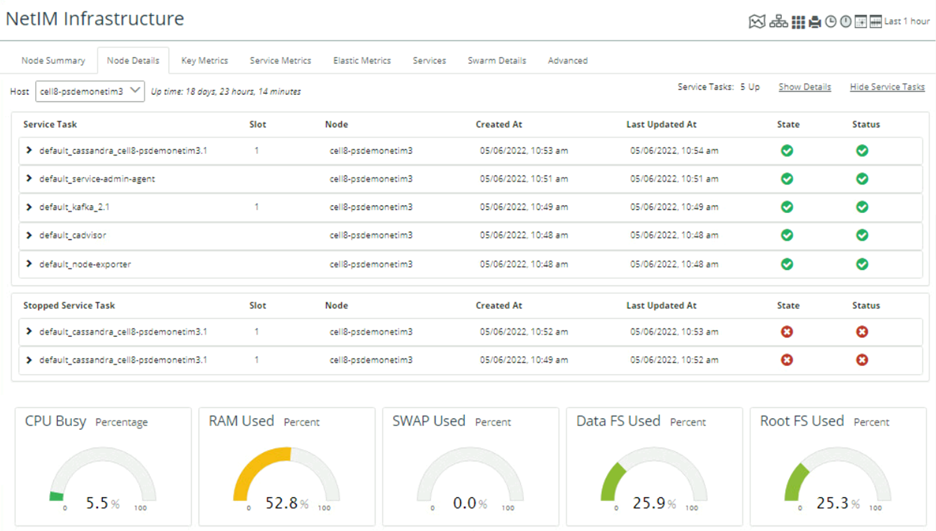
Monitoring NetIM via Infrastructure Details
Workers
The initial number of workers is determined in Alluvio NetIM System and Deployment Requirements Guide. The initial number accounts for the overall scaling of the deployment. Additional considerations include the type of data collected, the number of elements polled, and the frequency of collection. The collection of high-volume data, such as Class of Service metrics, increases the data collection and processing requirement. Where user-defined metrics (custom or specific) are implemented, the type, number, and frequency should also be considered. In each case, Workers can be added to meet growing or changing processing requirements as a deployment develops.
Determining the need for additional Workers is usually indicated in one of two ways:
1. Polling cycles and the related data transformation cannot be completed in the polling interval. This does not include polling exceptions that are attributed through troubleshooting to devices that are slow responders.
2. Monitoring via NetIM Infrastructure Interface. This portion of the NetIM user interface provides visibility into the operational state of NetIM systems, core services, and swarm services. The interface also provides visibility into key system metrics, service metrics, and advanced access to API functions. A review of the status and metrics in this interface provides insight into any sizing or capacity changes needed.
Monitoring NetIM via Infrastructure - Node Summary
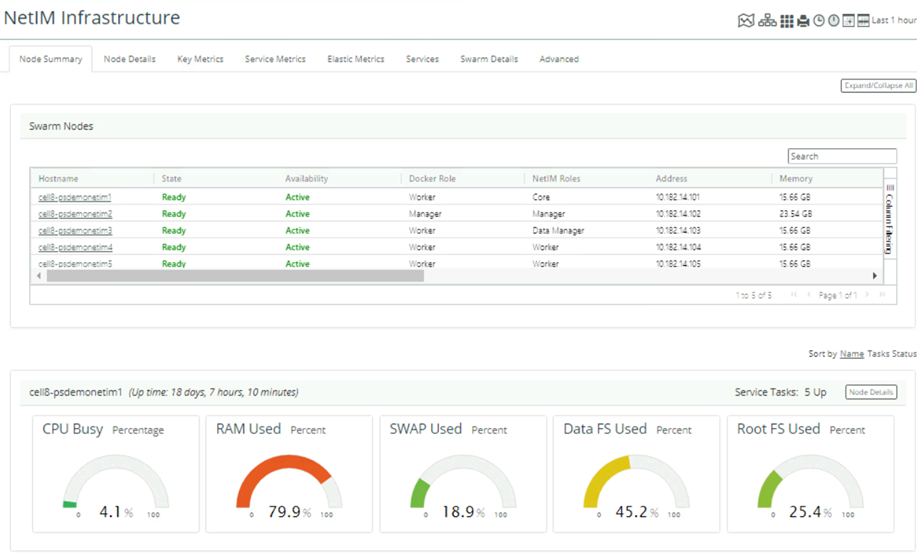
The information presented in the interfaces addresses customary, well-known values such as CPU and memory. It also provides information on a wide range of operational metrics for the services.
Monitoring NetIM via Infrastructure -Elastic Metrics