Common Data Collection Challenges in a Multivendor Environment
This chapter discusses the importance of deploying monitoring metrics (also called user-defined metrics) that are not included in NetIM by default. It explains how to create a particular metric to monitor a process or create a Management Information Base (MIB) component for a particular network or computing device.
When to use user-defined metrics?
NetIM provides functionality for the selection of specific or atypical metrics for collection. Using user-defined metrics (UDM) provides a means to fill gaps in monitoring by allowing the definition of one or more metrics to be included in metric polling.
Typically, the use of UDM is to provide supplemental data based on operational requirements. NetIM includes a significant library of MIB libraries including vendor-defined, engineering standards, and “de facto standards.”
UDMs are defined to enable the collection of metrics not included in baseline metric definitions. The most common cases where a UDM is employed include:
• When the metric is not enabled by default in NetIM.
• The MIB supporting the required metric is not included in NetIM.
• Devices supported by vendor-specific or proprietary MIBs.
• When you need custom MIBs to support atypical functions or niche devices.
In cases where a fully custom, user-developed MIB is used to transform data into metrics for import, see Chapter 6, “Leveraging Generic Metric Collection Through the NetIM Metric Import REST API,” for additional information.
Impact of UDM on polling and data transformation
UDMs in your NetIM require computing, memory, and storage resources and can impact the polling processes in your NetIM deployment. Make sure you correctly administer your existing resources and consider required growth in deployed VMs. See the “Sizing to avoid system resource issues” section in Chapter 4.
Identifying non-standard complying devices and new user-defined critical metrics
NetIM comes with an array of out-of-box critical metrics. See the “Built-in Metrics” in Appendix L of the Alluvio NetIM User Guide. Built-in Metrics include many metrics, but different metrics can be associated with a specific vendor or a particular use case. In some situations NetIM may not support critical metrics for a device, so you may need to manually deploy those particular metrics. You can use vendor-specific MIBs to create new user-defined critical metrics. In the following sections, we provide a strategy for how you might identify such metrics and their related MIBs for the Forcepoint firewall, but this strategy can apply to any vendor device.
Check the device vendor documentation to determine what other MIBs are supported on the devices. At a minimum, a device must support RFC1213/RFC3418 MIB, which provides the system and interface information. If the device does support these MIBs and SNMP is configured, then NetIM should be able to discover and create a basic model of the device. In the following figure, you see the corresponding support of RFC3418 MIB by the Forcepoint Next-Generation Firewall (NGFW) as referenced in the
Forcepoint Online Help Guide.
If RFC1213/3418 MIB is not supported on the device, the device will not be discoverable, and you will not be able to poll additional metrics. You can use the MIB browser to confirm if the device doesn't respond to polls of RFC1213/3418 MIBS.
Identifying other key metrics and MIB files
Forcepoint firewall supports the minimal set of generic required MIBs and should be discoverable by NetIM (using Built-in Metrics). Forcepoint has other vendor-specific MIBs that may contain metrics that might prove to be critical ones but are not automatically discoverable.
Forcepoint provides a detailed list of all the SNMP objects the device supports. This information is contained in the MIB files, and those files should be downloaded as well. You can download these MIBs from the vendors' websites such as OID View, Circitor, or MIB Depot if you don't have access to the vendor site.
Some common objects you will want to monitor are CPU and memory disk usage. To identify additional metrics to monitor, review the monitoring section of the user guide or the commands like references. As an example, for key monitoring components, see the Monitoring > Monitoring Forcepoint NGFW components section on
Forcepoint Online Help Guide.
The examples of monitor components include monitoring:
• users in the Home View.
• connections, blacklist, VPN SA's, users, routing, SSL VPNs, and neighbors.
• connections using Geolocation elements.
• configuration and policies.
• administrator actions.
• tasks.
Check the vendor documentation for screenshots of the device UI elements or access the device directly to see how the performance metrics are being visualized. This helps you identify critical performance metrics you want to monitor and how they might be visualized in NetIM. Click the links below to view screenshots of the metrics and their visualization styles as they are presented in the Forcepoint NGFW Web UI.
Check the support MIB object provided by the vendor or MIB files to identify potential. OIDs correspond with these performance indicators.
When identifying pollable objects, the object should be Alertable. Alertable objects will have SNMP data type syntaxes such as Integer, Counters, Unsigned, and Gauges.
Alertable object
fwConnNumber OBJECT-TYPE
SYNTAX CounterBasedGauge64
MAX-ACCESS read-only
STATUS current
DESCRIPTION
"Number of current connections"
::= { firewallObjects 4 }
Non-Alertable object
fwSecurityPolicy OBJECT-TYPE
SYNTAX DisplayString
MAX-ACCESS read-only
STATUS current
DESCRIPTION
"Name of the current security policy on the
firewall"
::= { firewallObjects 2 }
No restriction would prevent you from polling objects of other SNMP data types; however, you cannot set threshold violations or generate alerts and notifications for these metrics.
Don't create metrics comprised of configuration or topology objects. If you want to collect the configuration, topology, or specific aspects of a device, create a custom device driver that contains operational commands that collect and archive this information. If you want a device-specific topology new feature visualized in NetIM, contact Riverbed to submit a Request for Enhancement (RFE) new feature.
Adding supported devices to existing metric polling mappings
Vendors regularly release new device model types or update a device's OS version type. These changes can lead to the device having a sysobjectID that is not present in its polling MIB table mapping. As a result, some vendor-specific metric classes won't get polled by NetIM.
To verify and update an existing mapping
Cisco MGS is used as an example, but this example can apply to any existing device mapping.
1. Open a text editor. On the NetIM Core, open the file <install_dir>/lib/xml/res/DynamicPollingMIBTables.res. In it you will identify the vendor-specific Table Collection Mappings.
This example shows a few CPU_UTIL table mappings that NetIM has for the Cisco MGS device:
<!-- Cisco MGS is just a Linux host -->
<fs:compProperty name=".1.3.6.1.4.1.9.1.582-589,746,898-901" edit="none"> <fs:simpProperty name="Group Or Table Name">Host Resource Processor Util Group</fs:simpProperty>
For the MGS Cisco device, NetIM is polling the Host Resource Processor Util Group and the specific sysobjectID identifiers set in the compProperty.
2. Confirm if the sysobjectID of the new MGS devices is either specified or covered in the range of IDs. If not, add the sysobjectID unique numerical identifier to the range and save the file.
3. Search the file for this Host Resource Processor Util Group by name to locate its table mappings:
<fs:compProperty name="Host Resource Processor Util Group" edit="none">
<fs:simpProperty name="Host Resource Processor Util Table"/>
<fs:compProperty name="Host Resource Devices Entry Table">
<fs:compProperty name="Dependency Actions">
<fs:compProperty name="action_1">
<fs:simpProperty name="class">com.riverbed.sda.polling.core.datasource.snmp.service.condition.UseResultIndexAsIndexForAnotherTable</fs:simpProperty>
<fs:compProperty name="arguments">
<fs:simpProperty name="fromTable">Host Resource Processor Util Table</fs:simpProperty>
The NetIM Group maps to "Host Resource Processor Util" and "Host Resource Devices Entry Table".
4. Search the file for these tables to find the OID mappings for them:
<fs:compProperty name="Host Resource Processor Util Table">
<fs:simpProperty name=".1.3.6.1.2.1.25.3.3.1.1" dName="hrProcessorFrwID"/>
<fs:simpProperty name=".1.3.6.1.2.1.25.3.3.1.2" dName="hrProcessorLoad"/>
</fs:compProperty
<fs:compProperty name="Host Resource Devices Entry Table">
<fs:simpProperty name=".1.3.6.1.2.1.25.3.2.1.2" dName="hrDeviceType"/>
<fs:simpProperty name=".1.3.6.1.2.1.25.3.2.1.3" dName="hrDeviceDescr"/>
</fs:compProperty>
5. Use the MIB browser to query the new Cisco MGS device and confirm if these OIDs respond and return data. If they respond, the CPU_UTIL metric should start polling for the new mapping you added earlier. If the OIDs do not respond from the MIB browser, this existing mapping won't work.
6. Investigate the device further to see if there is an alternate OID that provides this metric and create a user-defined metric for it.
Creating new mappings for Linux-based appliance
You can only create mappings to tables and groups already defined. You cannot add new tables for different OIDs you want to map to the default metric classes.
If you have an appliance whose base OS is Linux, you can add additional mappings that allow NetIM to poll them using the default metrics for host node.
The default metrics use the Host Resource MIB. Some versions of Linux OS may be using the older UCD-SNMP MIB or the vendor may have implemented their own specific MIB that provides this information.
Adding new mapping can be error prone. Contact Riverbed Technical Support for assistance with defining and adding new mappings.
Strategic use of Pre-Collected Files Import
NetIM supports the import of configuration (command-line output) files. The Pre-Collected Files Import feature can be leveraged to import:
• files collected by other systems.
• files from inaccessible networks.
• synthetic configuration files to fill gaps in topology and monitoring.
Importing files collected by other systems
In environments where an existing configuration management tool is implemented and collects command-line data, NetIM can import that data for use in supporting topology accuracy, change detection, and completion of topology.
Importing files from inaccessible networks
An inaccessible network typically is defined as an adjacent network where NetIM has no direct credentials for polling and data collection or has no path to reach the network for polling and data collection. Where configuration data is collected in the inaccessible network and provided to NetIM, the files can be imported.
Importing synthetic configuration files
The NetIM’s topology inference engine is usually able to build connected network topologies. On occasion, missing intermediate information can result in topology gaps. Where this is caused by missing or inaccessible devices, such as service provider network equipment, a configuration file can be created and imported to NetIM to fill the gaps.
A synthetic configuration file is used to represent one or more devices. Synthetic configuration files are formatted in the same manner as a device configuration file but typically include missing topology elements. These files can be created manually or generated by automated means. Examples might include devices missing from a local, campus, or wide area network. The needed elements can be included in the synthetic configuration file for import to NetIM. The NetIM topology inference engine will then have the needed information to close the gap(s) in the topology.
The topology shown was missing a network management element (metro-eth-01n). The management network is owned by a service provider that does not allow polling or configuration collection.
Example of Inferred Topology
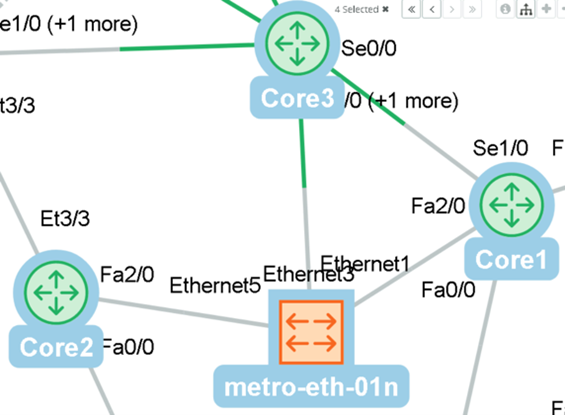
To complete the network topology, a synthetic configuration file was created. The configuration file is imported through the Pre-Collected Files input. This configuration file (see example below) provides enough information for the topology inference engine to connect the relevant interfaces.