Viewing Memory Paging Reports
The Reports > Diagnostics > Memory Paging report provides the total number of memory pages, per second, utilized in the time period specified. It includes the following table of statistics that describe memory paging activity for the time period you specify.
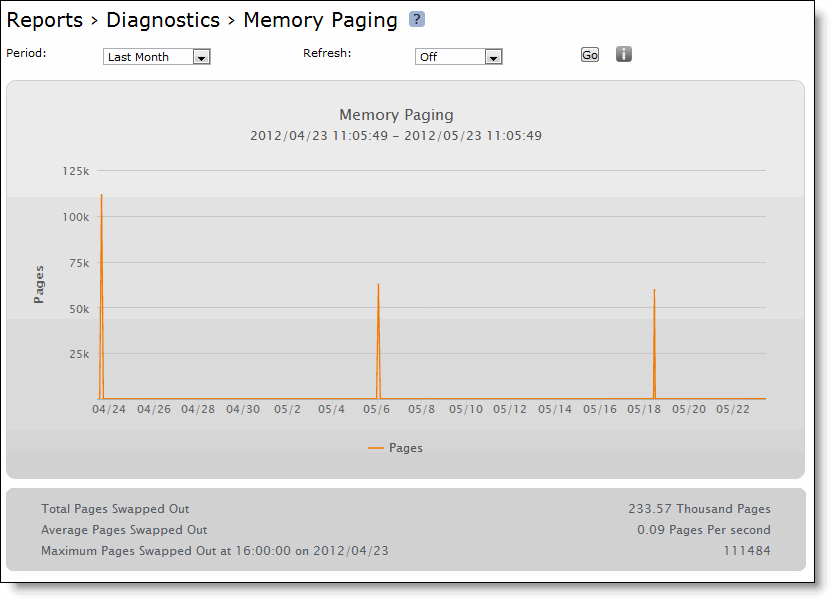
Note: If the Memory Paging report shows that thousands of pages are swapped every few minutes, contact Riverbed Support at
https://support.riverbed.com.
Field | Description |
Total Pages Swapped Out | Specifies the total number of pages swapped. If 100 pages are swapped approximately every two hours the Mobile Controller is functioning properly. |
Average Pages Swapped Out | Specifies the average number of pages swapped. If 100 pages are swapped every couple of hours the Mobile Controller is functioning properly. |
Maximum Pages Swapped Out At <time> on <date> | Specifies the date and time that the maximum number of pages were swapped. |
What This Report Tells You
The Memory Paging report answers the following questions:
• How much memory is being used?
• What is the average and maximum amount of memory pages swapped?
About Report Graphs
In bar-graph and line-graph reports, the x-axis (or tick mark) plots time, according to the interval you select. The y-axis plots the metric of interest, such as gigabytes (GBs) of bandwidth, percent (%) of data reduction, connection counts, and the like.
Drag your cursor over an area of interest to zoom. Click Reset Zoom to return to normal view. To display only one data type (for example, WAN, LAN) click the name of the data in the graph legend.
Pie chart graphs do not indicate peaks or averages. Pie chart graphs represent the aggregate for the time period selected.
To view the Memory Paging report
1. Choose Reports > Diagnostics > Memory Paging to display the Memory Paging page.
Figure: Memory Paging Page
2. Use the controls to customize the report as described in this table.
Control | Description |
Period | Select Last Hour, Last Day, Last Week, Last Month, or Custom from the drop-down list. If you select Custom, specify a Start Time and End Time to configure a customized time interval report. Use the following format for specifying a start and end time: yyyy/mm/dd hh:mm:ss. |
Refresh | Select one of the following options to set a rate to refresh the report display: • To refresh your report every 5 minutes, select 5 Minutes. • To refresh your report every 10 minutes, select 10 Minutes. • To refresh your report every 15 minutes, select 15 Minutes. • To turn off refresh, select Off. Note: The refresh rate sets the rate at which the results of polling are displayed, not the polling rate itself. Polling occurs every five minutes. |
3. Click Go to display your report.