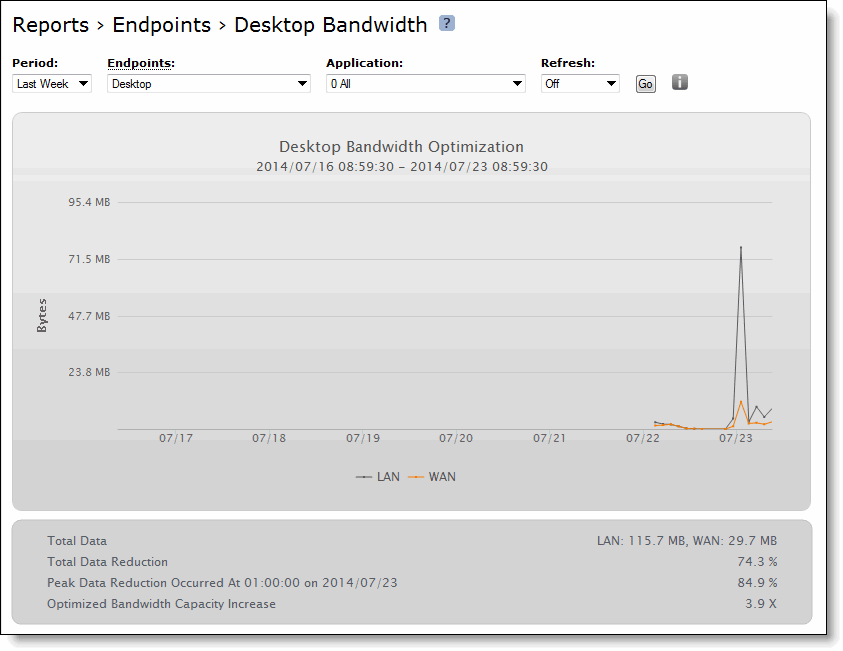
Figure: Desktop Bandwidth Page

Field | Description |
WAN Data | Specifies the bytes transmitted over the WAN. |
LAN Data | Specifies the bytes transmitted over the LAN. |
Total Data Reduction | Specifies the percent decrease of data transmitted over the WAN as a result of optimization, according to the following calculation: (Data In – Data Out)/(Data In) |
Peak Data Reduction Occurred At | Specifies the time that the peak data reduction occurred. |
Optimized Bandwidth Capacity Increase | Specifies the increase in the amount of data transmitted over the WAN as a result of optimization, according to the following calculation: 1/(1-Reduction Rate) |

Control | Description |
Period | Select Last Hour, Last Day, Last Week, Last Month, or Custom from the drop-down list. If you select Custom, specify a Start Time and End Time to configure a customized time interval report. Use the following format for specifying a start and end time: yyyy/mm/dd hh:mm:ss. |
Endpoints | Select All from the drop-down list for a report on all endpoints connected to the Mobile Controller, or select a specific endpoint from the list. |
Network | Select All from the drop-down list for a report on all networks or select WiFi, 3G/4G, or Roaming. |
Application | For desktop endpoints - Select All from the drop-down list for a report on all applications connected to the Mobile Controller, or select a specific application from the list. |
Refresh | Select a refresh rate option for the report display: 5, 10, or 15 Minutes. Or, select Off to turn off refresh. Note: The refresh rate sets the rate at which the results of polling are displayed, not the polling rate itself. Polling occurs every five minutes. |