Home Page and Menu Bar
The top of every page displays the menu bar. The current state of the system appears to the right of the menus—Healthy, Admission Control, Degraded, or Critical—and is always visible. A status of Healthy (Needs Attention) indicates that the management tasks that do not affect optimization are needed. For details, select the current system status to display the Alarm Status page.
Figure: Mobile Controller Menu Bar

The system saves settings on a per-user basis. A message appears at the top of each page when more than one user is logged in, explaining that user preferences might be overwritten.
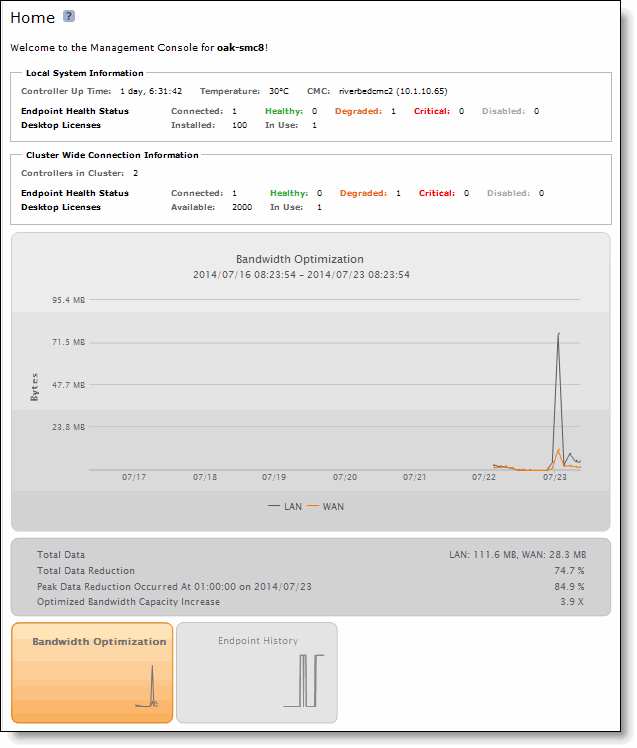
The Home page displays the controller up time, temperature (if the Mobile Controller is not virtual), CMC hostname (if you have one in your network), connected clients, licenses in use, and the status of the clients (healthy, degraded, critical, and disabled).
In Mobile Controller 5.0 and later, the Home page also displays cluster information, if a cluster is configured. The Cluster Wide Connection Information lists the number of controllers in the cluster, installed and free licenses, connections and licensed connections, and the status of the clients in the cluster (healthy, degraded, critical, and disabled).
The Home page also displays the following reports:
• Bandwidth Optimization - Summarizes the throughput or total data transmitted by all clients over the WAN and the LAN in the last week. In Mobile Controller 5.0 and later, this graph also shows the number of desktop licenses installed and in use.
• Endpoint History - Displays the endpoints that are connected to the controller and the licensed endpoints. By default, endpoint data for the past week is shown. In Mobile Controller 5.0 and later, this graph also shows the history of desktop endpoints.
Figure: The Home Page (Bandwidth Optimization Report)
In Mobile Controller 5.0 and later, there are panes for the Bandwidth Optimization and Endpoint History reports at the bottom of the Home page. Click a pane to display the report you want to see.
Navigating in the Management Console
You can navigate to the tools and reports available to you in the Management Console using hyperlinked tabs and menus.
To display cascading menus
1. Select the Configure, Manage, and Reports menus to display the submenus. For example, select Reports to display the submenus Endpoints, Diagnostics, and Export. The menu item that is currently active is highlighted.
2. To go to a page, slide your cursor down to the submenu item you want to display and select the menu name. For example, under Reports > Optimization, select Bandwidth Optimization to display the page.
The following table summarizes the cascading menus.
Tab | Purpose |
Home | Displays the current status of your system and verifies bandwidth optimization. |
Configure | Networking - Configure host settings, network interfaces, and port labels. |
SSL - Configure peering, signing CA, and certificate authorities. |
System Settings - Configure announcements, alarms, monitored ports, SNMP basic, SNMP v.3, SNMP ACIs, email, and logging. |
Security - Configure general security settings, user permissions, RADIUS, TACACS+, secure vault, and web settings. |
Maintenance - Configure scheduled jobs, licenses, software upgrade, reboot/shutdown. |
Cluster - Configure cluster settings. |
My Account - Change your password and configure user roles. |
Configurations - Apply a saved configuration. |
Manage | Configure policies, packages, and assignments. |
Reports | Create and display endpoint reports and diagnostic reports and export reports to files and email. |
Support | Displays contact information for Riverbed Support, software and hardware information, MIB files, and the online help. |
Save | Save current settings on all pages. |
Healthy/Degraded/Critical/Unlicensed | Click the status display to navigate to the Reports > Diagnostics > Alarm Status page. |
Displaying Report Details
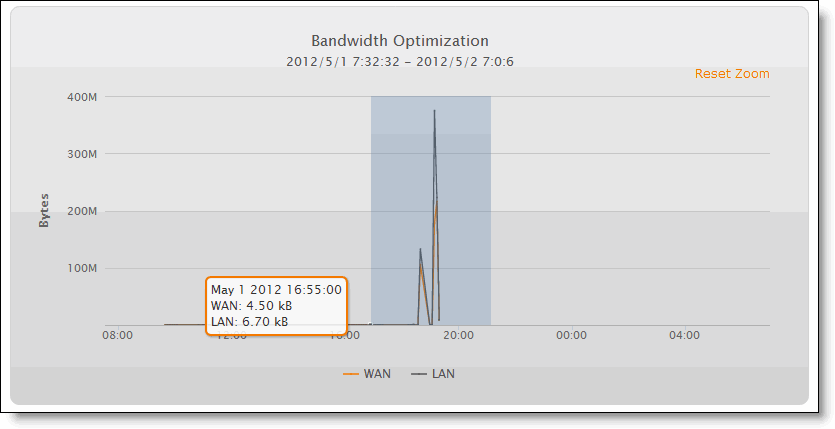
You can zoom in to display report details.
To display chart details
1. Click and drag your cursor across an area of interest to you.
Figure: Highlight Area of Interest
2. Release the cursor to magnify the highlighted area.
Figure: Magnified Area
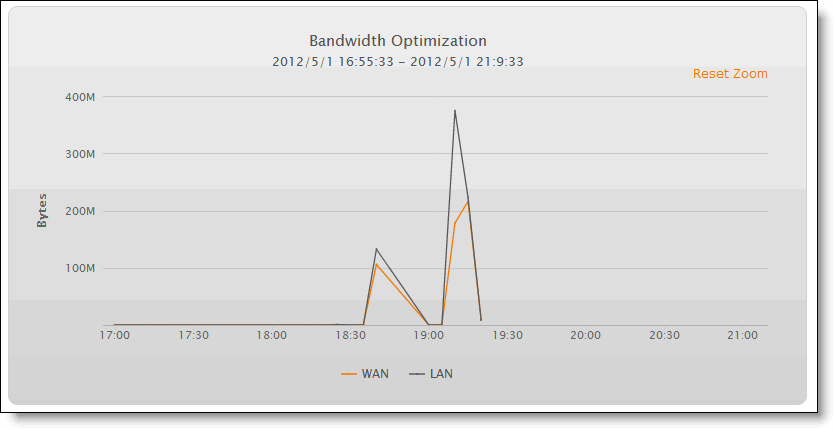
3. To return to the original report view, click Reset Zoom or refresh your browser.
Saving Your Configuration
Most Management Console configuration pages include an Apply button for you to commit your changes. When you click Apply, the Management Console updates the running configuration, but your changes are written to disk only when you save your configuration.
The Save icon on the menu bar alerts you if the changes you have made require saving to disk.
To permanently save the changes, click Save.
Logging Out
Click Logout in the upper-right corner of the screen to log out of the current session.
Printing Pages and Reports
You can print Management Console pages and reports using the print option on your web browser.
To print pages and reports
• Choose File > Print in your web browser to open the Print dialog box.