About the dashboard
The Dashboard displays the system hostname in the upper-left corner. There, you’ll also find an colored icon that indicates the system health. You can also view system health in the System Status section. Health states are Healthy, Admission Control, Degraded, or Critical.
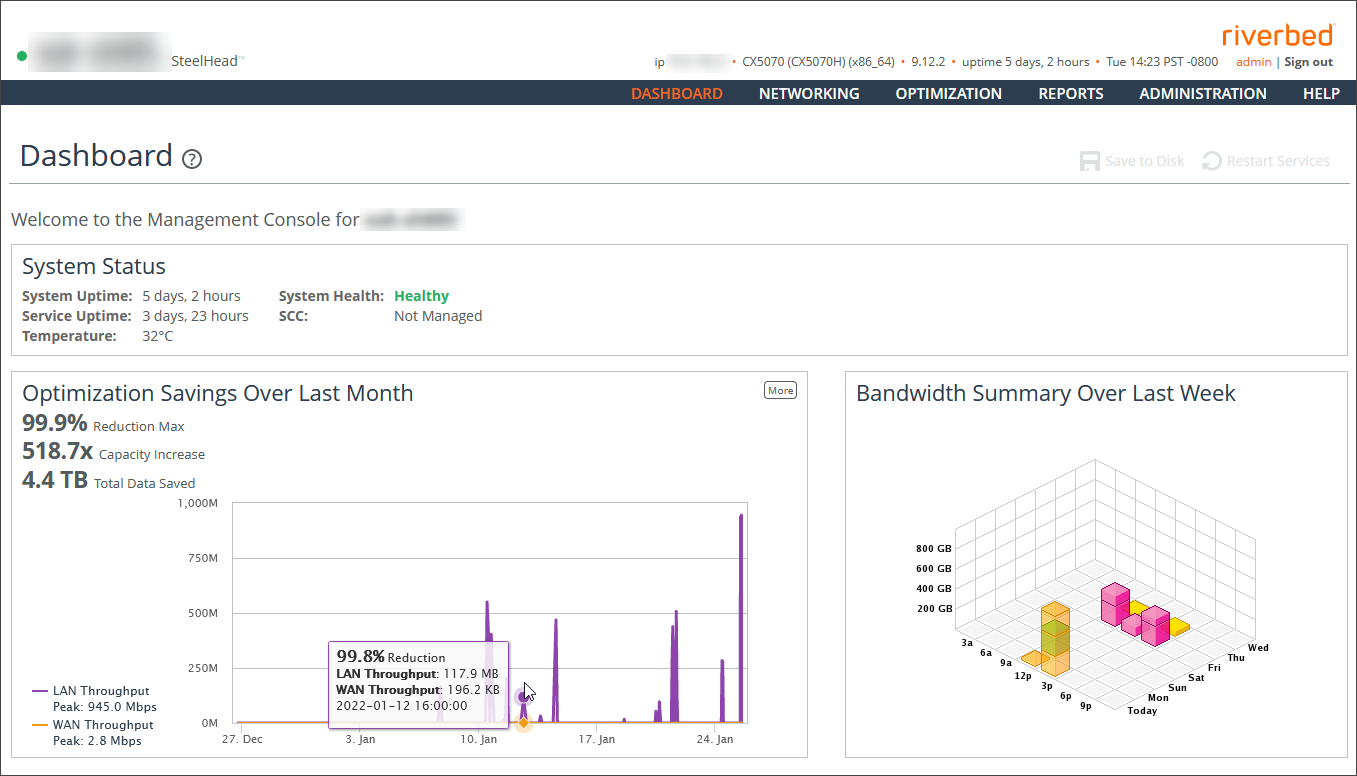
Management Console dashboard
The Dashboard also displays these summary reports:
System Status
Displays the system up time, service up time, temperature, system health and the SCC hostname (if you have one in your network).
Optimization Savings Over Last Month
Summarizes the average bandwidth reduction, average capacity increase, and total amount of data saved for the month. Mouse over the graph to view statistics for a specific time. You can also see WAN and LAN peak throughput (total optimized data transmitted for all applications) in the last month.
Bandwidth Summary Over Last Week
Provides a three-dimensional view of traffic patterns (byte counts) over the last week. Each column represents the number of bytes, the time of day, and the day of the week. For example, the report might display that there were 4 GB of WAN traffic from 12 P.M. to 3 P.M. on Wednesday of the prior week.
Navigating in the Management Console
The Management Console uses cascading menus. Mouse over a menu to display its options. Click an option to display that Management Console page.
Saving your configuration
Most Management Console pages include an Apply button. When you click Apply, your configuration changes are applied to the running configuration. If you want to save your changes permanently, you’ll need to click Save to Disk.
A red outline around a setting indicates that it’s required. You must specify a valid entry for all of the required items before you can apply or save your changes.
Restarting the optimization service
The optimization service (also referred to as simply the service) is a daemon that executes in the background, performing required operations.
Some configuration settings affect the service. When you change settings for features that depend on the service, you’ll need to restart it for the changes to take effect.
To restart the service, click Restart Services or choose Administration > Maintenance: Services and then restart the service from the Services page.
Signing out
Click Sign out in the upper-right corner of the page to sign out of the current session.
Printing pages and reports
You can print Management Console pages and reports using the print option on your web browser.