Monitoring SaaS data usage
The SaaS Data Usage page includes two tabs.
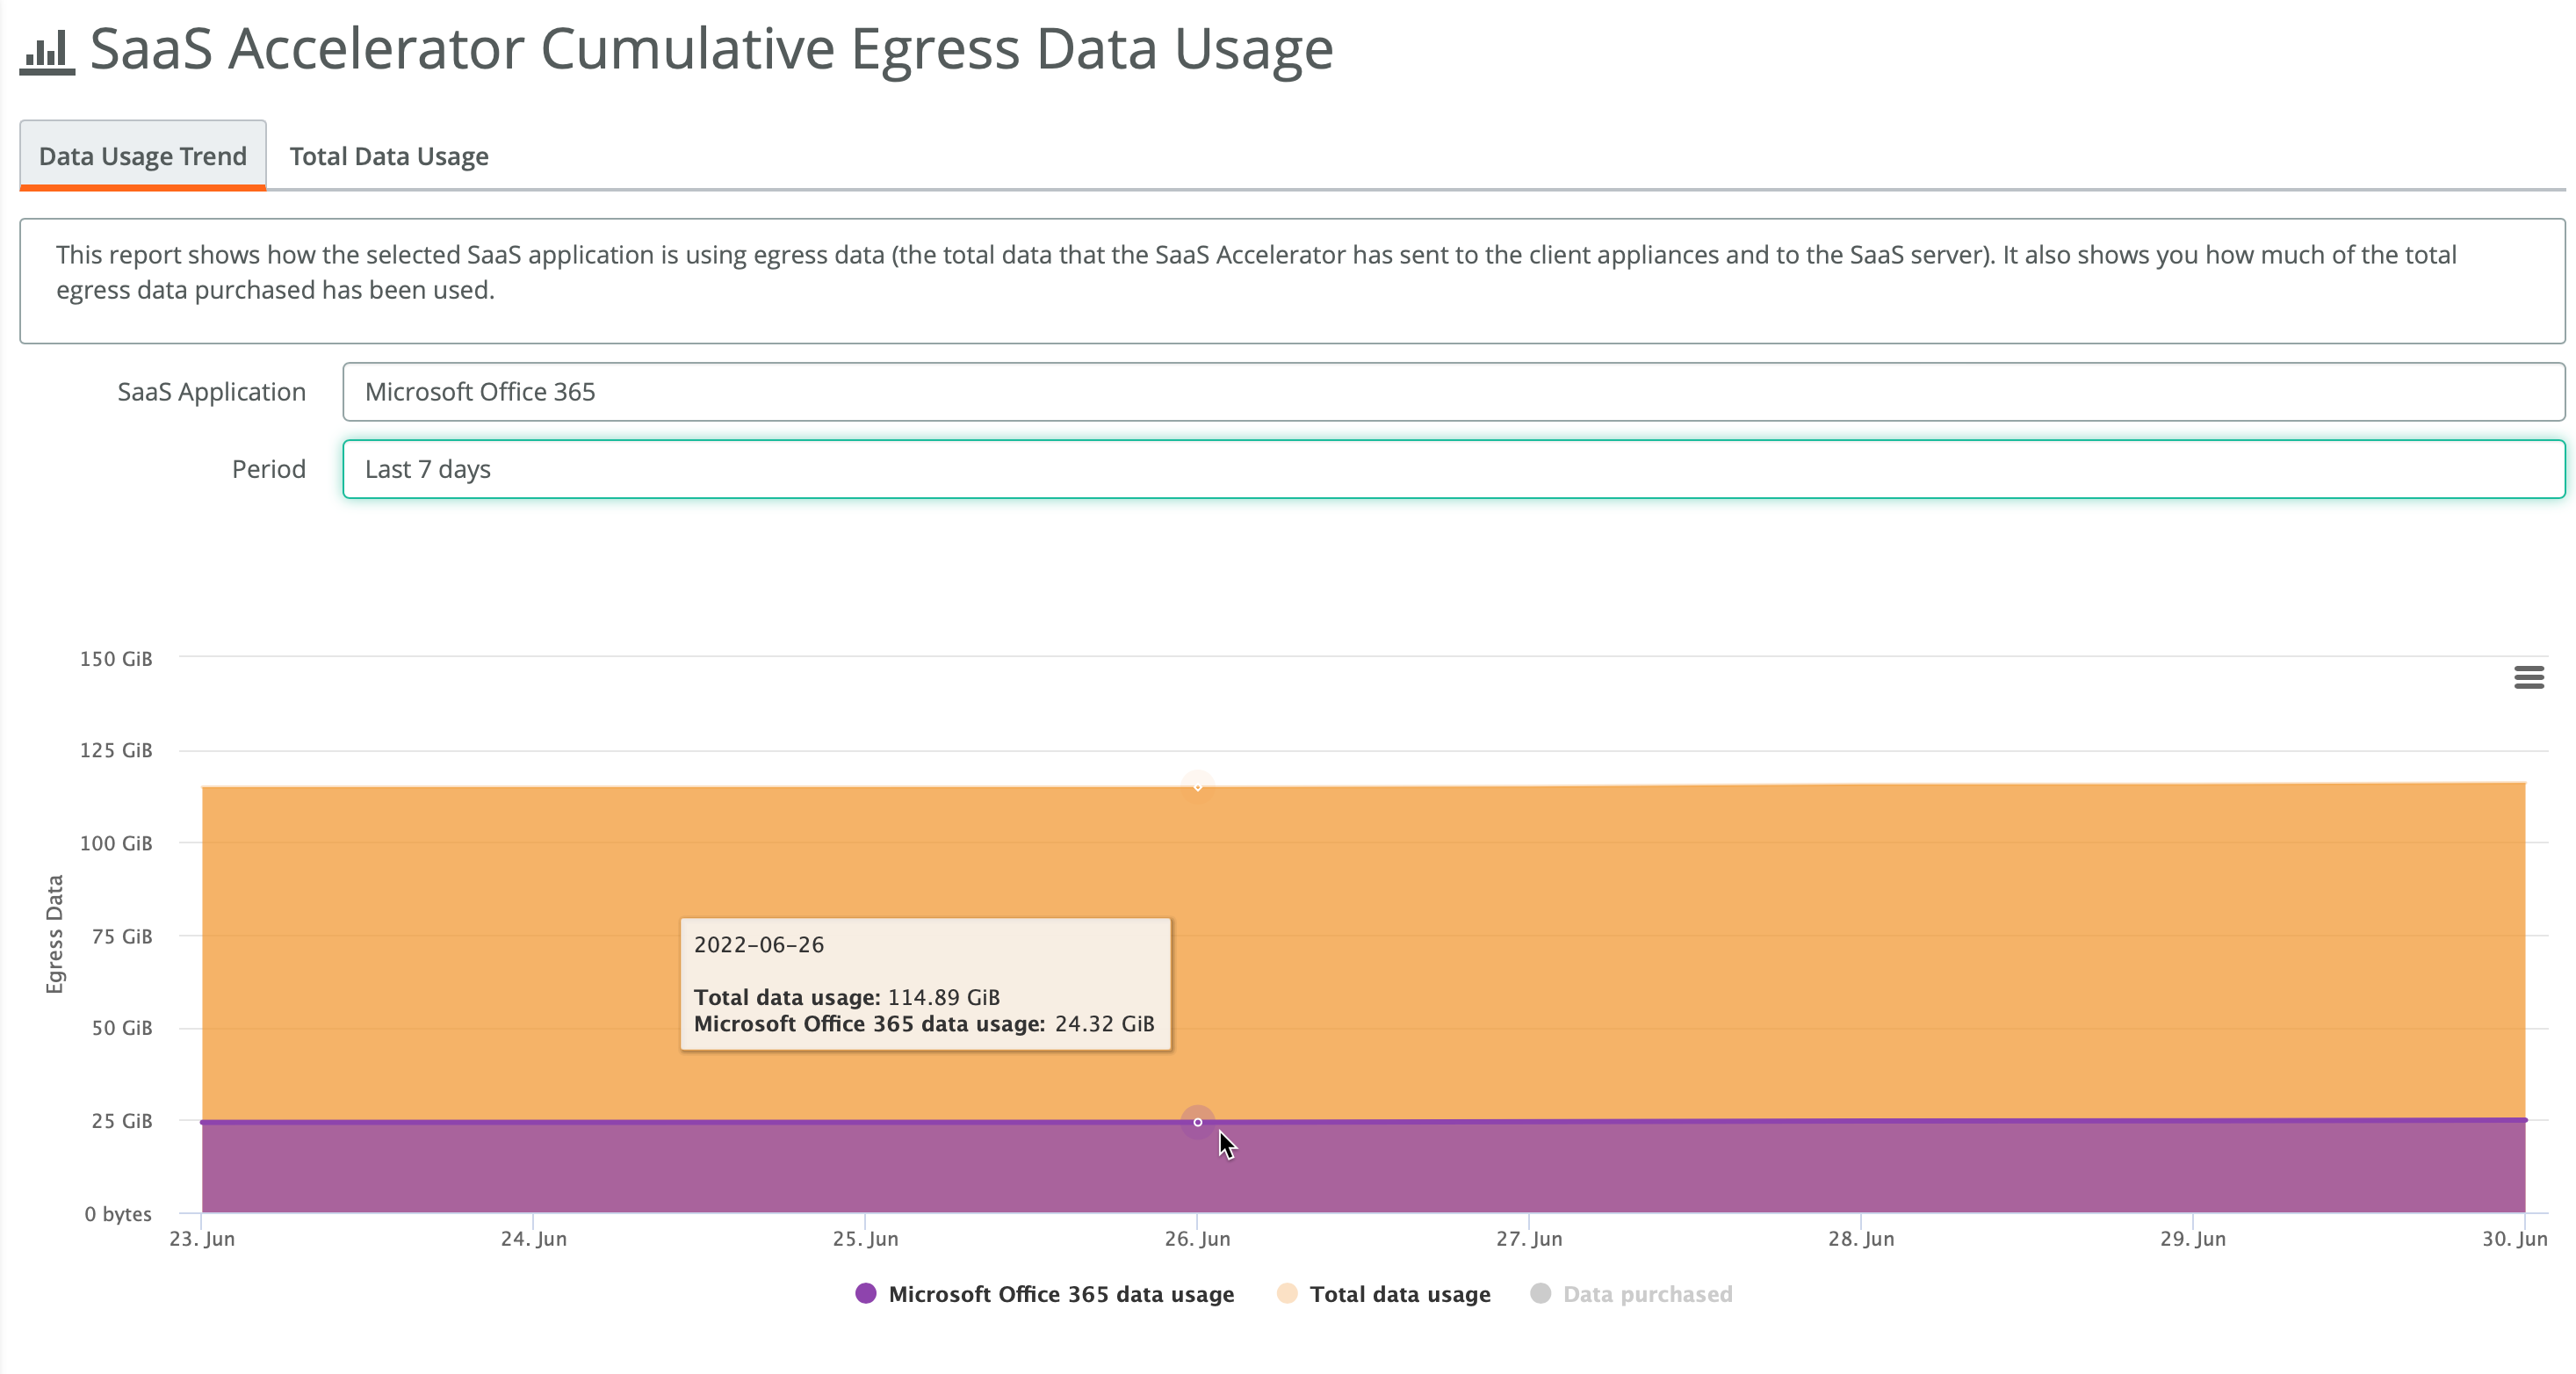
The Data Usage Trend tab shows how the selected SaaS application is using egress data (the total data that the SaaS Accelerator has sent to the client appliances and to the SaaS server), and how much of the total egress data purchased has been used. Filter this data by selecting a specific application and by clicking the links below the chart.
SaaS data usage trend
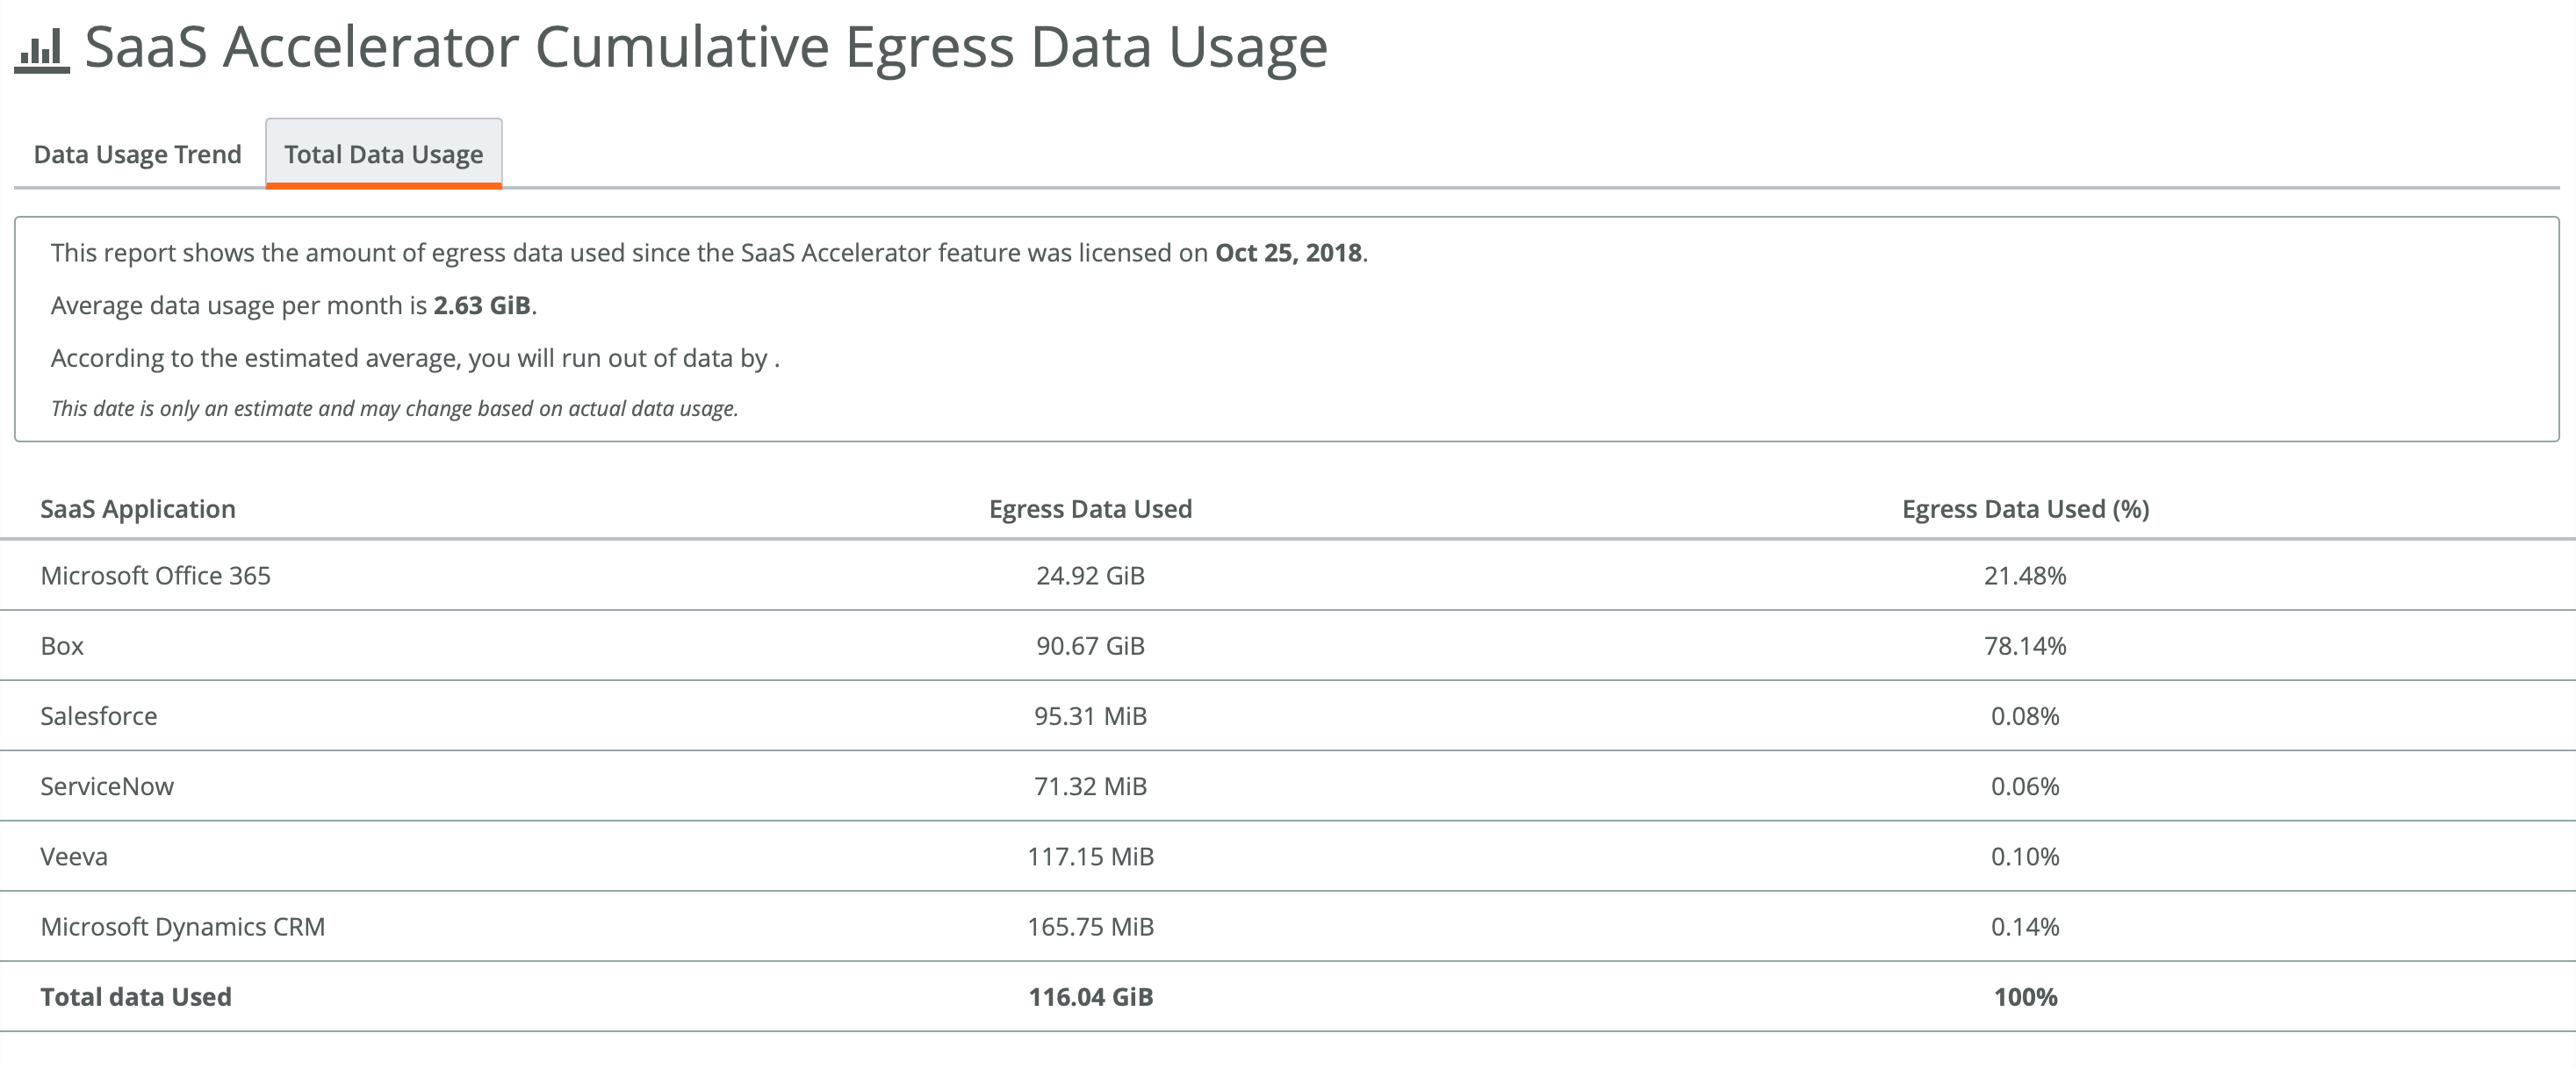
The Total Data Usage tab shows the amount of SaaS service egress data used since the SaaS Accelerator feature was licensed, average data used per month, an estimated date when you will reach your data limit, and breakdown by application of egress data used in units and as a percentage of total data used.
SaaS total data usage
1. Choose Reports > Data Usage.
2. Select a tab.
Monitoring data reduction for accelerated SaaS traffic
The Optimization Summary report shows the total data reduction provided by SaaS Accelerator since it was configured and lets you filter it by time period. The report also shows the data reduction for each configured SaaS application.
SaaS Data Reduction report
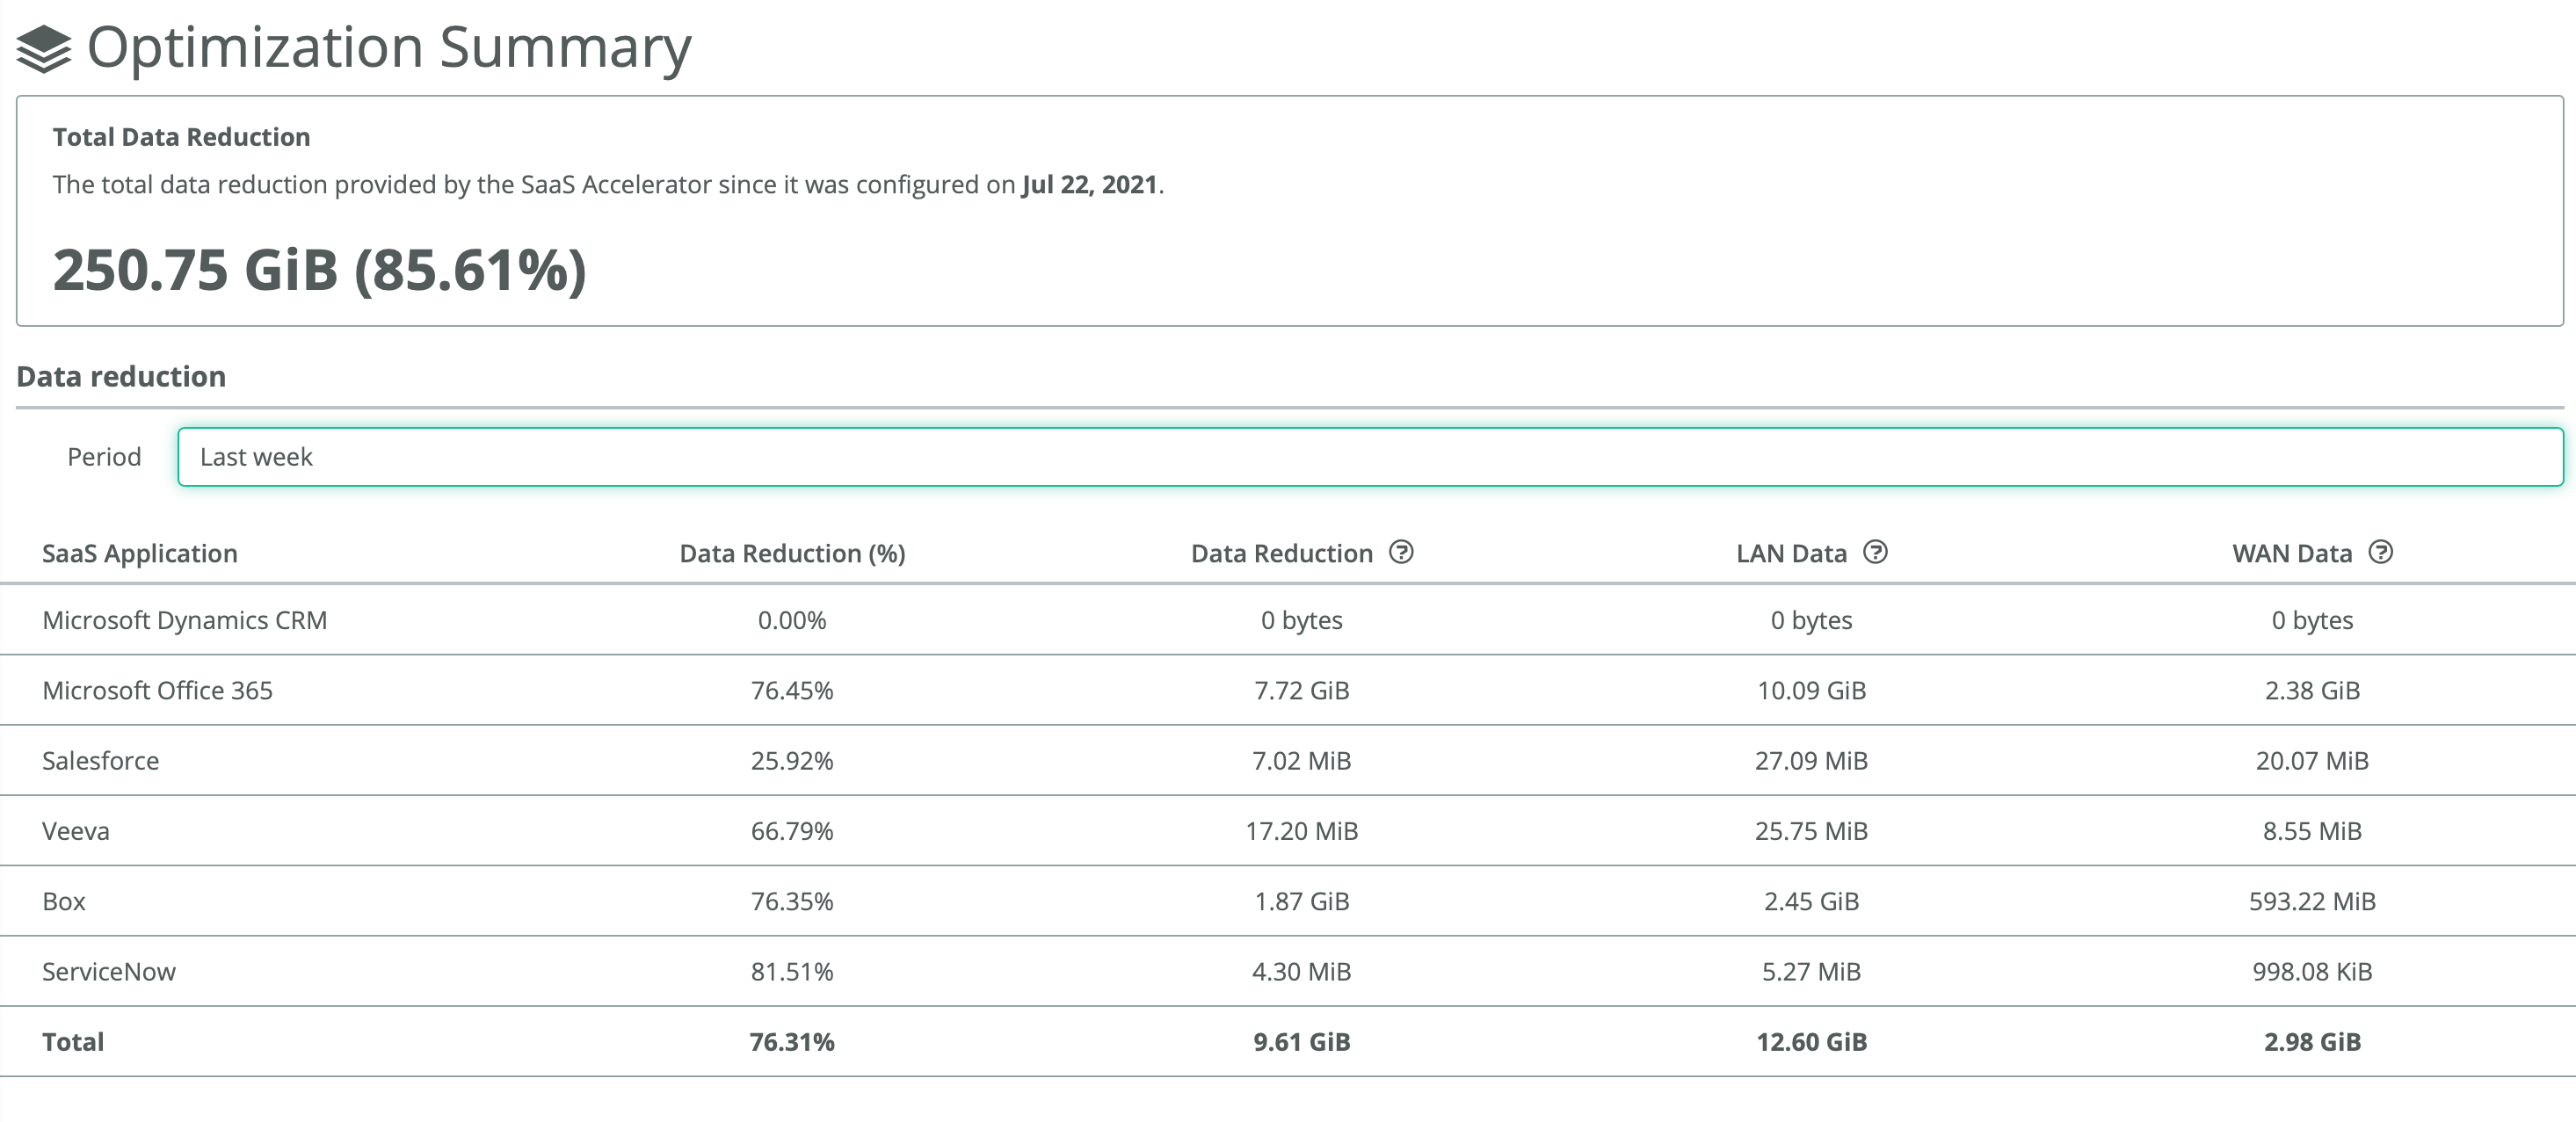
• Choose Reports > Optimization Summary. You can filter the results by time period ranging from the last hour to the last year.
The LAN Data column displays the amount of data transferred between the SaaS service cluster and the SaaS servers. The LAN data includes ingress and egress traffic on the SaaS LAN side.
The WAN Data column displays the amount of data transferred between the SaaS service cluster and the client-side appliances. The WAN data includes ingress and egress traffic on the WAN side.
Data Reduction is a percentage based on LAN data compared to WAN data.