Viewing web proxy reports
The Web Proxy page provides these reports:
• Optimization Report - Lists LAN and WAN data transfer and cache-hit ratio for sites or site types. The cache-hit ratio is aggregated across all the SteelHeads. The report displays hourly data points for the one month.
• Top 10 Report - Displays the top 10 domain requests, top 10 domains by size, and the top 10 URLs by size for sites or site types.
To view optimized web proxy sites or site types
1. Choose Reports > Optimization: Web Proxy to display the Web Proxy page.
Figure: Web Proxy Optimization report
2. Select All Sites to display all sites or select Site or Site Type and specify the site in the text box.
3. Click Optimization or Cache Hit Ratio to select the type of report.
4. Use the mouse to hover over a specific data point to see the y values at that time stamp.
To view the top 10 domains for web proxy sites or site types
1. Choose Reports > Optimization: Web Proxy to display the Web Proxy page.
Figure: Web Proxy Top 10 report
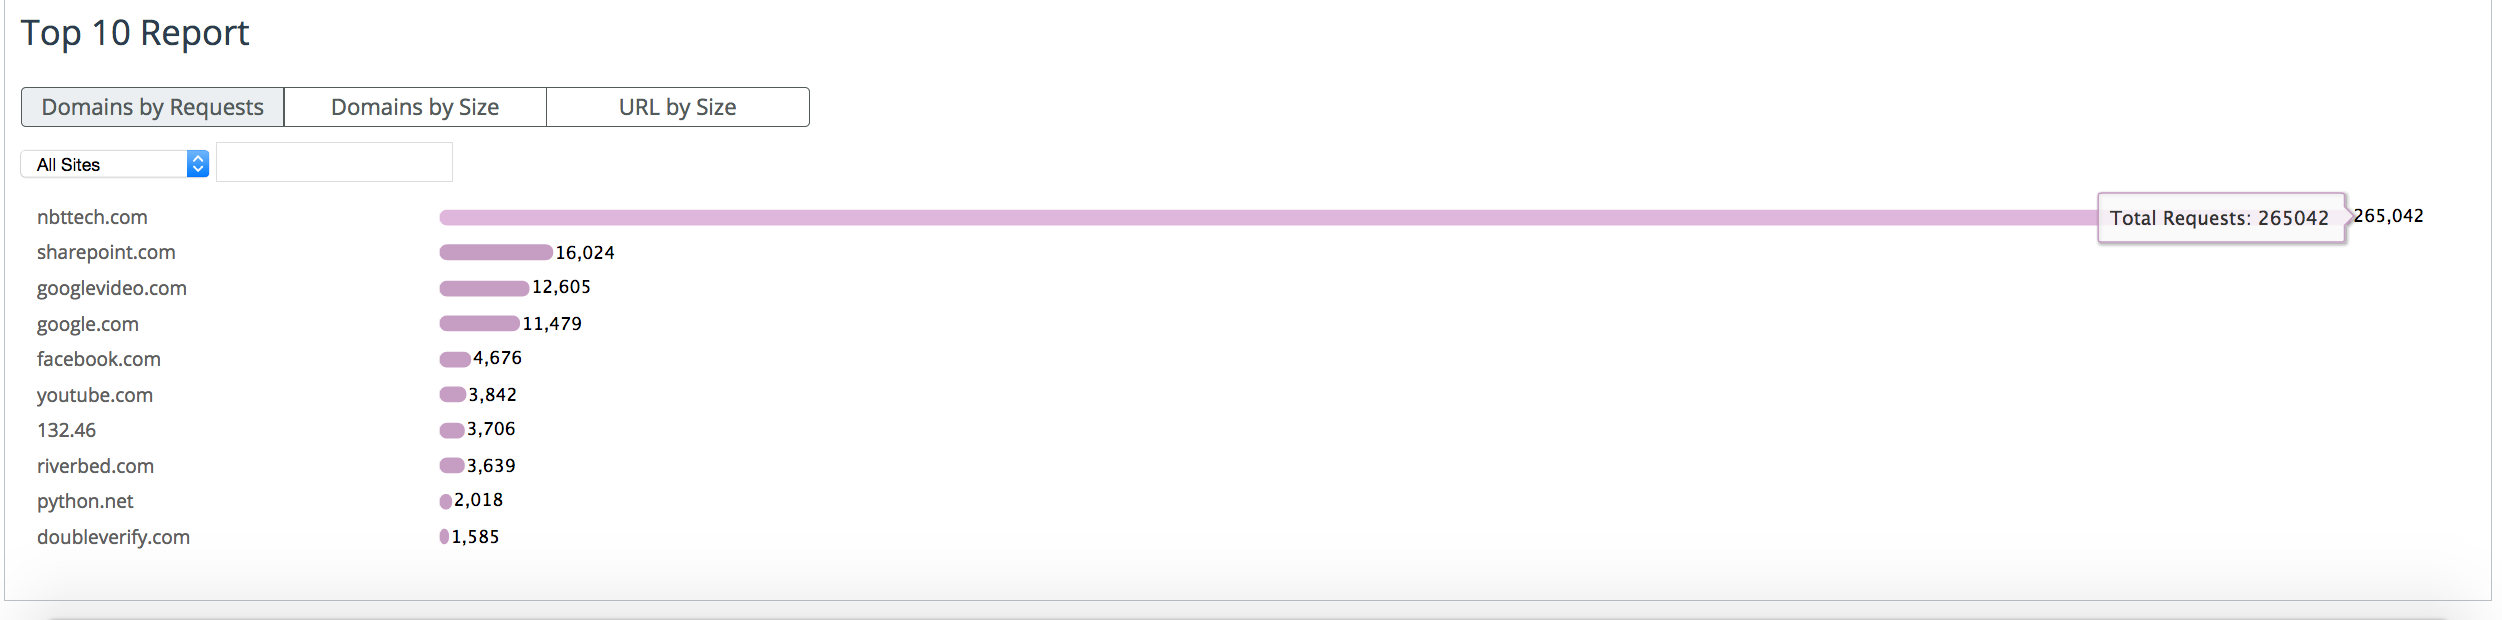
2. Select All Sites to display all sites or select Site, or Site Type and specify the site in the text box.
3. Click Domains by Requests, Domains by Size, or URL by Size to display the type of report.
4. Use the mouse to hover over a specific data point to see the y values at that time stamp.