Viewing Alerts
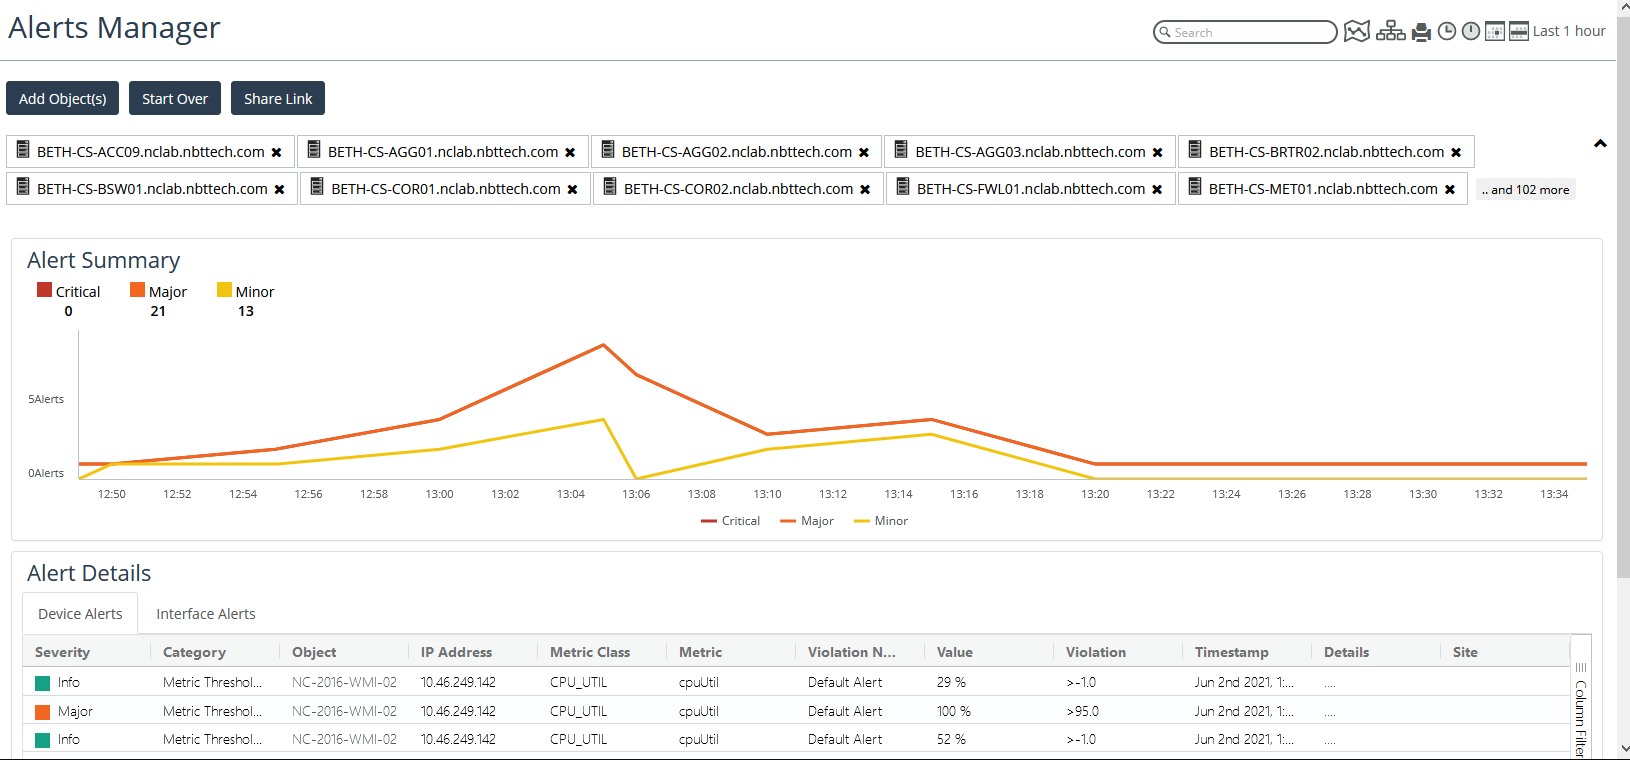
The Alerts Manager provides an easy way to visualize and explore alerts that have occurred in your infrastructure. Within this page, you can see a broad summary of your network alerts, as shown in the figure below, or you can filter based on a specific time or object(s) for a targeted view, which is helpful for troubleshooting.
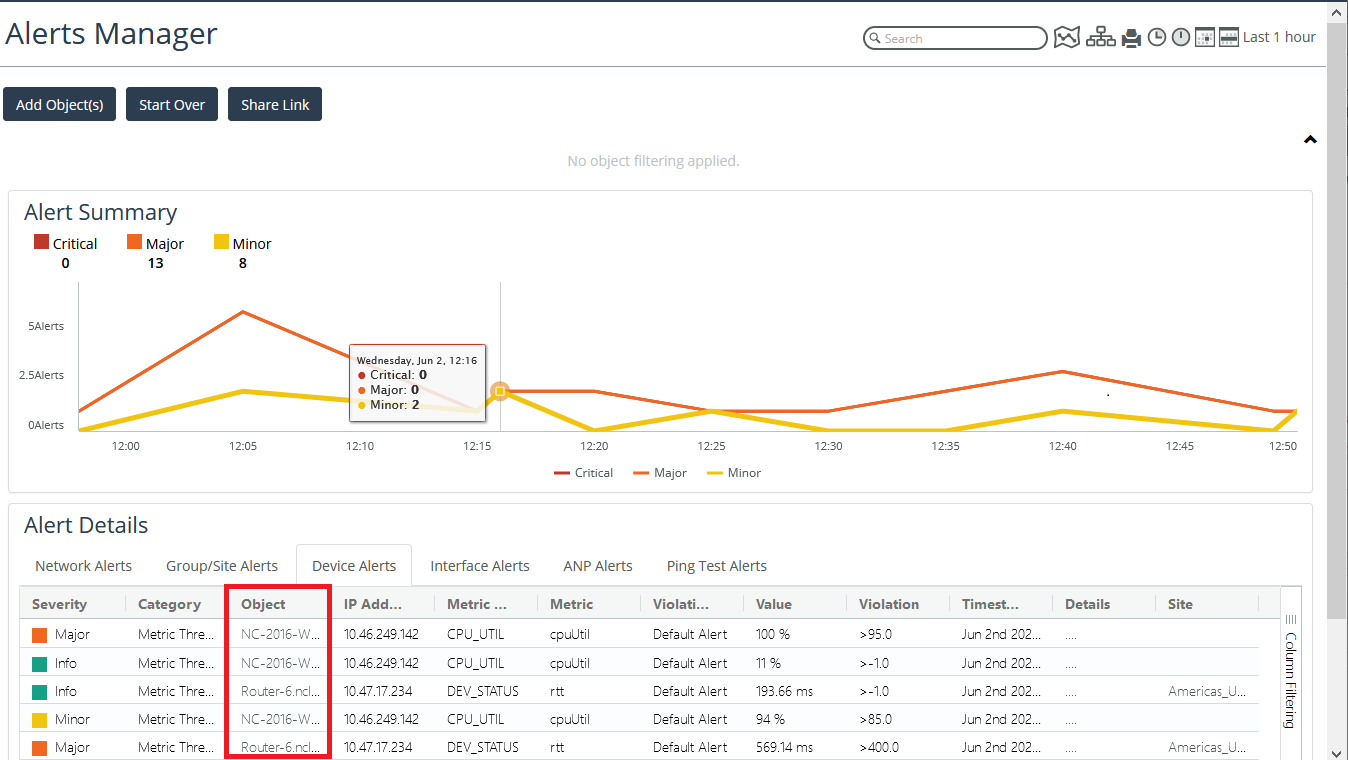
The Alerts Manager is accessed from the Alerts option on the main menu bar, as shown in the following screen:
The Alerts Manager consists of two main sections, as shown in the preceding screen.
• Alert Summary - provides a summary total of Critical, Major and Minor Alerts, with an attendant graphic view of color-coded lines for Critical, Major, and Minor alerts over a specified time, which provides mouse over information for each alert.
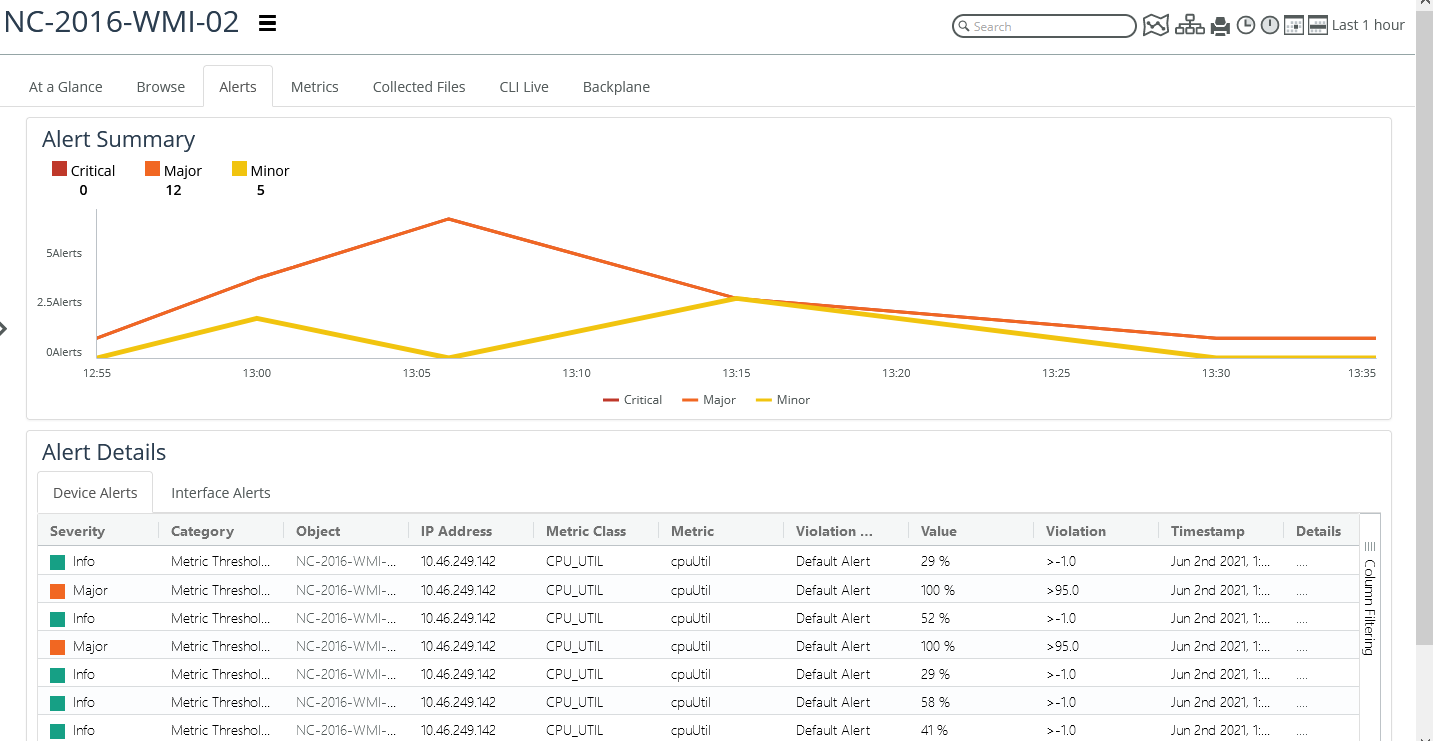
• Alert Details - provides a tabular listing of alerts, with a link under the Object column which takes you to the Alert tab on the object page for each object, as shown in the following screen:
Using the Alerts Manager
By default, the Alerts Manager shows all events and alerts for your infrastructure for the time window currently selected. From this top-level view, you can filter the events to see only certain event severities, narrow the view to particular objects of interest, or examine a specific time window.
Alerts include syslog messages and traps against devices and interfaces not managed by NetIM. All syslog messages and traps are persisted. If they are not mapped against a managed device or interface they will be stored against the network.
Viewing Alerts by Time
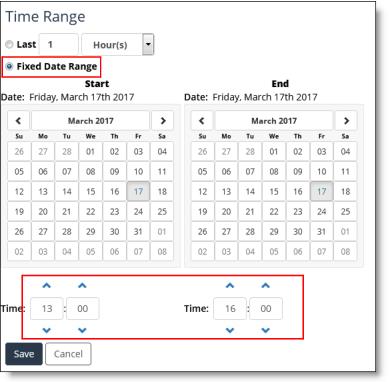
As in other areas of NetIM, you can use the time controller to set the date/time rage in your view. For example, if you know that you had problems in your network between 13:00 and 16:00 p.m. today, choose Fixed Date Range and set the day and time, as shown in the following screen:
Filtering Alerts by Object
By default, the Alerts Manager shows events for your entire infrastructure; however, you may want to narrow your focus to one or more sites, groups, interfaces or devices. To do this, use the Add Object(s) button at the upper left of the Alerts Manager page.
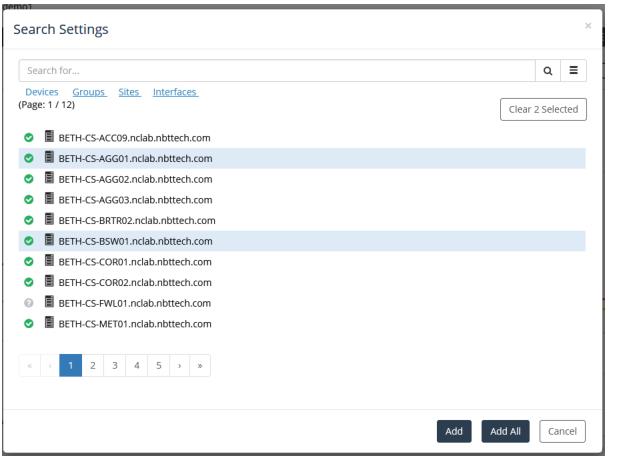
The following screen appears:
On this screen you can do the following:
• Identify objects of interest by doing one of the following:
– Search for one or more objects of interest in the Search for dialog box.
– Click on the Devices, Groups, Sites, Interfaces links for the complete list of those objects
• Add the objects of interest to the Alerts Manager page by doing one of the following:
– Click the Add All button to add all alerts against all objects
– Select one or more objects of interest and click the Add button to add the object(s) and attendant alerts.
The Alerts Manager refreshes with alert information from the list of chosen objects, as shown in the following screen:
After you add the selected objects, only events for those objects are shown in the viewer. Additionally, an icon for each selected event is shown above the chart. To stop viewing events for an object, simply click the X on the object to remove it. To quickly clear all selections, click the Start Over button.
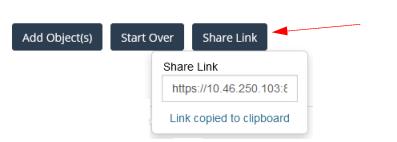
Sharing an Alerts Manager View
You can retrieve a URL for the current view in the Alerts Manager by clicking on the Share Link button in the upper left corner of the page. The following screen appears:
You can then send the link to persons of interest.
Related Topic