Viewing Endpoint reports
The Reports > Endpoints: Endpoint Report page provides information about the managed endpoints.
An Endpoint report lists every endpoint client that has connected to the controller and any other controllers in the same cluster. The report summarizes the overall status of your Client Accelerator endpoints: username, connection status, controller, IP address, software version, group, policy, percent of data reduction, amount of data sent over the LAN and WAN, warmed data, and time connected. The Endpoint report provides statistics that describe endpoint client activity for the time period you specify, as shown in the bottom right of the report.
The Endpoint report displays icons for both types of clients: Windows or Mac. The icons appear dimmed if the client is unlicensed, and they appear bright orange if the client is licensed.
If the controller is part of a cluster and you set aggregated statistics, in the Desktop Traffic, Desktop Bandwidth, SSL, Branch Warming, and Endpoint History reports display time-series data aggregated across the entire cluster. The Endpoint report displays the latest state of each client across the cluster. A message appears at the bottom of the report stating whether the data was successfully retrieved from all the cluster members. For details, see
About Controller Clusters. The Endpoint report for Client Accelerator 5.5 and later also has a Settings tab that lets you choose the columns that appear in the report. In addition, on the Endpoints tab, three sub-tabs let you filter the report contents, perform system operations on endpoints, and remove one or more selected endpoints as shown here:
What this report tells you
The Endpoint report answers these questions:
• What is the current connection status of my controller?
• What is the health and controller connection status?
• How much data was transmitted for each controller?
To view an endpoint report or change the report display
1. Choose Reports > Endpoints: Endpoint Report to display the Endpoint Report page.
2. To change the columns displayed in the report, click the Settings tab.
3. Select or clear the check boxes for the report columns, based on this table.
Control | Description |
Group | Displays the controller group. |
Policy | Displays the policy assigned to the controller. |
Total Reduction | Displays the amount of data reduction for the controller. |
LAN Data | Displays the amount of data transmitted over the LAN during the selected time period. |
WAN Data | Displays the amount of data transmitted over the WAN during the selected time period. |
Warmed Data | Displays the total warmed data from the local controller for the period specified when branch warming is turned on. |
Connected At | Displays the connection time for the controller. |
Detailed Status | Displays the detailed status for the controller. |
4. Click Apply to make your changes.
Filtering Endpoint reports
Select the Filters tab on the Endpoint report page to set or change the list of endpoint clients displayed, based on a variety of factors.
Endpoint Report page—Filters tab

To filter endpoint reports
1. On the Endpoint Reports page, click Filters (if it is not already highlighted).
2. Use the controls to customize the report as described in this table.
Control | Description |
User | Specify one or more usernames. Separate multiple usernames with commas. |
License | Select All, Licensed, or Unlicensed. |
Connection duration | Select All Connections Intervals, or an interval ranging from five minutes to one month. |
Statistics period | Select an interval ranging from the last hour to last month. |
Endpoints per page | Select All Endpoints, or 20, 50, or 100 endpoints. |
IP Address/Subnet | Specify the IP address and subnet. |
Detailed Status | Specify a sting to filter results by detailed status. Specifying a partial string is sufficient. For disconnected endpoints, the search matches the last reported status. |
Status | Specify the current state of the controller from the drop-down list: • All—Indicates that all data is requested. • Connected—Indicates that the endpoint is connected to the controller. – Healthy—Indicates that all systems are functioning properly. – Degraded—Indicates that system has detected an error when communicating with an endpoint. – Critical—Indicates that the optimization service is not running. Contact your system administrator. – Disabled—Indicates that the optimization service is turned off. • Disconnected—Indicates that the connection to the endpoint is down. |
Version | Select All to filter on all software versions, or select one or more particular software versions. This filter only appears when more than one value is present among the currently connected the Client Accelerator endpoints. |
Group | Specifies one or more groups of Client Accelerator endpoints to display. This filter only appears when more than one value is present among the currently connected the Client Accelerator endpoints. |
Controller | Select or clear All, or one or more controllers. This filter only appears when more than one value is present among the currently connected Client Accelerator endpoints. |
Policy | Select or clear All, or specific policies assigned to the controller. This filter only appears when more than one value is present among the currently connected Client Accelerator endpoints. |
Apply Filter | Adds filters. |
3. Select or clear one or more endpoints on the endpoint list below the Filters pane.
4. Click Apply Filter to make your changes.
Removing endpoint information
Select the Remove Selected Endpoints tab to remove the current information stored in the Endpoint report for one or more endpoints. Under normal circumstances, this information is replaced periodically with new information from the controller.
Clicking Remove Endpoint does not disable or remove the controller on the end user’s machine.
To remove information for endpoints
1. Select the Remove Selected Endpoints tab.
2. Select the check box next to one or more endpoint usernames.
3. Click Remove Endpoint to make your changes.
Performing endpoint operations
Select the Endpoint Operation tab to perform system tasks such as resetting connections and requesting dump files, on selected endpoint clients.
To perform system tasks on endpoint clients
1. On the Endpoint Reports page, select the Endpoint Operations tab.
2. Use the controls on this tab to perform any of the tasks described in this table.
Control | Description |
Reset Client - CA Controller Connection | Select the check box next to one or more endpoint usernames, and click Reset Client - CA Controller Connection to reset the connection between the controller and the endpoint client. |
Restart Client Accelerator Endpoints | Select the check box to restart Client Accelerator endpoints. |
Request System Dump | Select the check box next to one or more endpoint usernames, and click Request System Dump to upload the files. A system dump contains endpoint logs, configuration information, process information, and other diagnostic information to use for troubleshooting. HTTP must be enabled on the controller to upload files from your endpoint. |
Request Memory Dump | Uploads the memory dump files. A memory dump can be very large and can take time to upload. HTTP must be enabled on the controller to upload files from your Client Accelerator endpoint. To view memory dump files, see
Viewing the memory dumps list. |
Request TCP Dump | Select the check box next to one or more endpoint usernames and click Request TCP Dump to upload the files. • Duration—Specify a time interval. HTTP must be enabled on the controller to upload TCP dump files from your Client Accelerator endpoint. |
Edit Package Assignments | Select the check box and select the package from the drop-down list. |
Edit Policy Assignments | Select the check box and the policy from the drop-down list. |
3. Select or clear one or more endpoints on the endpoint list below the Operations pane.
4. Click Apply Action to produce the desired results.
5. Click Save to Disk to permanently save your settings.
Viewing Endpoint User information
On the Endpoint Reports page, you can display additional detailed information about an individual endpoint. The information is organized across several tabs.
Endpoint User page
To view endpoint user details
1. Click an entry in the User column to expand details for that user.
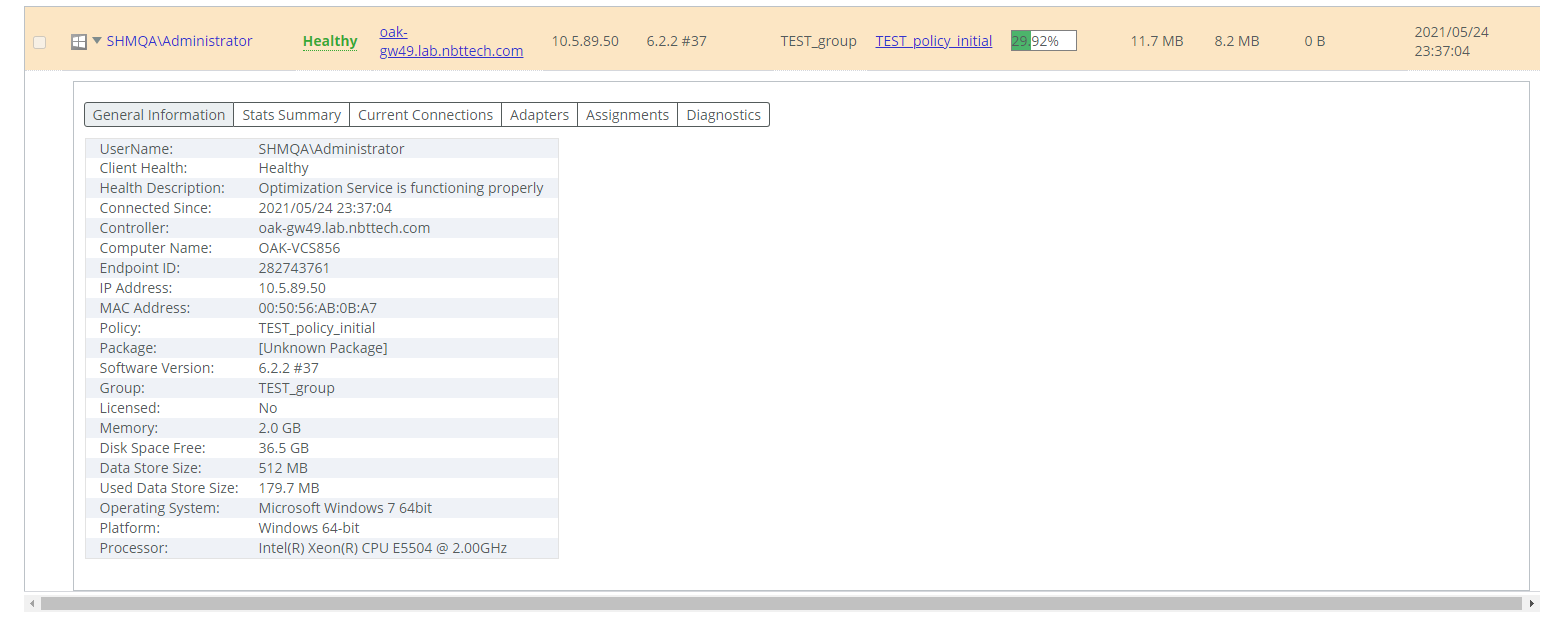
2. Click the tabs at the top of the expanded user detail information to view detailed information about the endpoint user. These tabs are available:
– General Information—Includes general information about the endpoint user, the user’s computer, and the user’s controller, including client health, health description, computer name, IP address, policy, package, Client Accelerator software version, license status, memory, free disk space, and data store size.
– Bandwidth Summary—Includes the amount of WAN data, warmed data, LAN data, total data reduction, number of SSL requests, and how many SSL requests were optimized.
– Current Connections—Lists the endpoint’s current connections by the running process with the source and destination port and information about the percent of data reduction.
– Adapters—Lists the Ethernet and other network adapters currently in use on the endpoint.
– Assignments—Lists the package and policy currently assigned to the endpoint, and provides drop-down lists for selecting a different policy or package.
– Diagnostics—Provides links to any memory dumps, system dumps, and TCP dumps that have been run for the endpoint with a time stamp, file size, and MD5 sum for the dump file. Admin privileges are required to view the Diagnostics tab.