Viewing Branch Warming reports
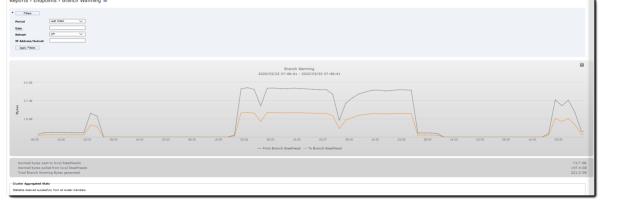
The Reports > Endpoints: Branch Warming report summarizes the overall bi-directional warming benefits to and from the branch SteelHead for every endpoint connected to the controller.
The Branch Warming report includes this table of statistics that describe branch warming utilization for the time period you specify.
Field | Description |
Warmed bytes sent to local SteelHeads | Specifies the count of warmed bytes sent to the local SteelHead from Client Accelerator endpoints. |
Warmed bytes pulled from local SteelHead | Specifies the bytes pulled from the local SteelHead rather than transferred over WAN because of branch warming. In addition, it indicates the percentage share of warmed bytes in total bytes generated by the client. |
Total Branch Warming Bytes generated | Specifies the sum of bytes sent to the local SteelHead from the Client Accelerator endpoints plus the bytes pulled by the Client Accelerator endpoints from local SteelHeads. |
What this report tells you
The Branch Warming report answers this question: How many bytes were pushed and pulled to warm the branch SteelHead and Client Accelerator data stores?
To view a Branch Warming report
1. Choose Reports > Endpoints: Branch Warming to display the Branch Warming page.
Branch warming with aggregated statistics
If the controller is part of a cluster and you set the aggregated statistics, the endpoint report displays time-series data aggregated across the entire cluster. A message appears at the bottom of the report stating whether the data was successfully retrieved from all the cluster members. For details, see
About Controller Clusters. If the controller is part of a cluster and you do not set aggregated statistics, the report only shows data from the current Client Accelerator Controller.
2. Manipulate the report as you like:
– Drag your cursor over an area of interest to zoom.
– After dragging, click the Reset Zoom link that appears to return to normal view.
– To hide or show a data type (Branch In or Branch Out), click that type in the graph legend.
3. Use the controls to customize the report as described in this table.
Control | Description |
Period | Select Last Hour, Last Day, Last Week, Last Month, or Custom from the drop-down list. If you select Custom, specify a Start Time and End Time to configure a customized time interval report. Use this format for specifying a start and end time: yyyy/mm/dd hh:mm:ss |
User | Specify a string to filter results by user. Specifying a partial user ID is sufficient. For pattern matching, use the wildcard character (*). To search for multiple users, separate user string by commas. |
Refresh | Select a refresh rate option for the report display: 5, 10, or 15 Minutes. Or, select Off to turn off refresh. The refresh rate sets the rate at which the results of polling are displayed, not the polling rate itself. Polling occurs every five minutes. |
IP Address/Subnet | Specify the IP address and subnet. |
4. Click Apply Filters to display the customized report.
5. Click Save to Disk to permanently save your settings.