About the SharePoint report
The SharePoint report displays the FPSE and WebDAV performance improvements for the time period specified.
Before you can view these statistics, on the client-side appliance, choose Optimization > Protocols: HTTP, select Enable Per-Host Auto Configuration, select FPSE and WebDAV and click Apply.
SharePoint reports contain this information:
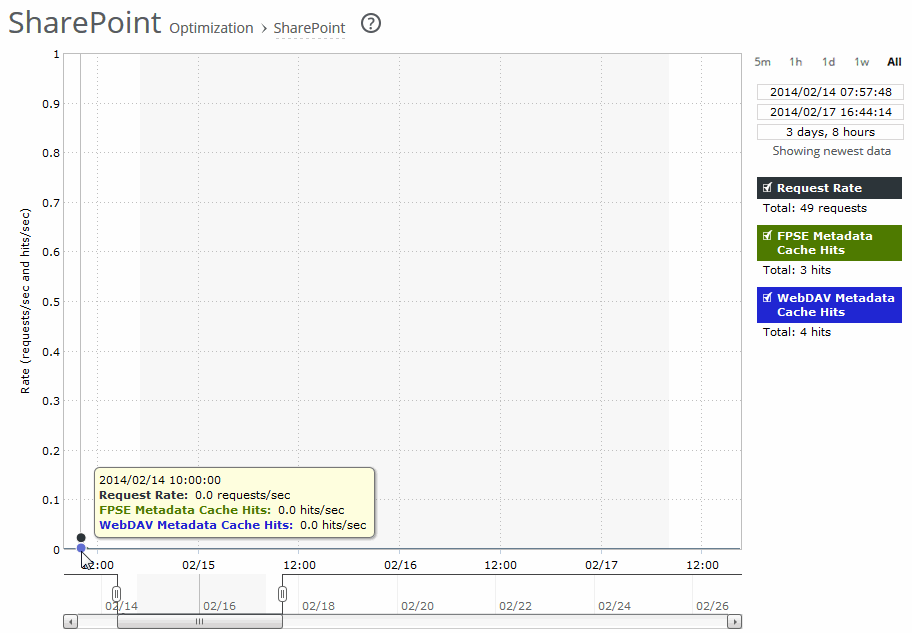
Request Rate
Displays the total number of FPSE and WebDAV requests per second.
FPSE Metadata Cache Hits
Displays the Microsoft Front Page Server Extensions (FPSE) metadata cache hits per second. Shows how many FPSE requests were served locally, resulting in performance improvements. SSL connections and files smaller than 5 MB can experience significant performance improvements.
Microsoft Office 2007/2010/2013 clients use FPSE when communicating with SharePoint 2007/2010 servers.
WebDAV Metadata Cache Hits
Displays the Microsoft Web Distributed Authoring and Versioning (WebDAV) metadata cache hits per second. RiOS predicts and prefetches WebDAV responses, which saves multiple round-trips and makes browsing the SharePoint file repository more responsive.
The navigator shadows the request rate series.
The SharePoint report answers this question:
• How many FPSE and WebDAV responses were served locally?
About report graphs
Mouse over a specific data point to see what the y values and exact time stamp were in relation to peaks.
About report data
The Riverbed system reports on performance for periods up to one month. Due to performance and disk space considerations, the display granularity decreases with time passed since the data was sampled. The data is collected at a 5-minute granularity for the entire month.
Viewing the SharePoint report
You view the SharePoint report under Reports > Optimization: SharePoint.
SharePoint page
Use this control to customize the report:
Time interval
Specifies a report time interval of 5 minutes (5m), 1 hour (1h), 1 day (1d), 1 week (1w), All, or type a custom date. All includes statistics for the last 30 days. Time intervals that don’t apply to a particular report are dimmed.
For a custom time interval, enter the start time and end time using the format yyyy/mm/dd hh:mm:ss
You can view the newest data and see data points as they’re added to the chart dynamically. To display the newest data, click Show newest data.