About the SSL report
The SSL report displays the SSL requested and established connection rate for the time period specified.
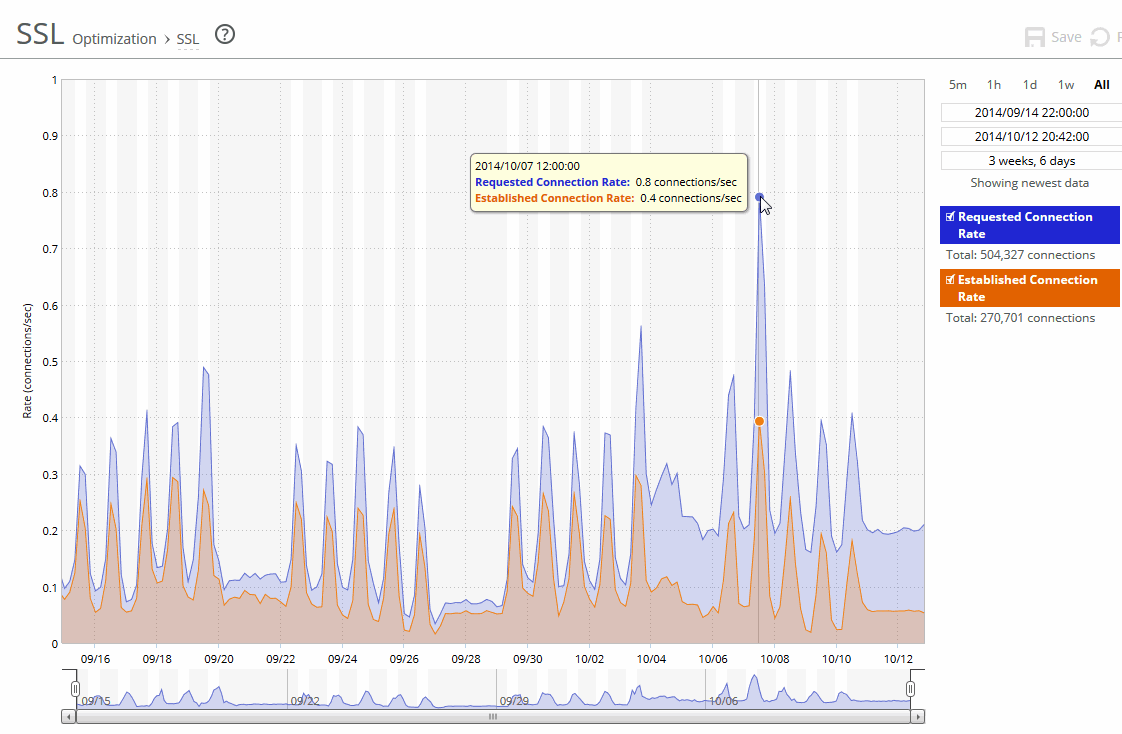
SSL reports contain this information:
Requested Connection Rate
Displays the rate of requested SSL connections.
Established Connection Rate
Displays the rate established SSL connections.
The navigator shadows the requested connection rate series.
The SSL report answers these questions:
• What is the rate of established SSL connections?
• What is the rate of connection requested SSL connections?
About report graphs
Mouse over a specific data point to see what the y values and exact time stamp were in relation to peaks.
About report data
The Riverbed system reports on performance for periods up to one month. Due to performance and disk space considerations, the display granularity decreases with time passed since the data was sampled. The data is collected at a 5-minute granularity for the entire month.
Viewing the SSL report
You view the SSL report under Reports > Optimization: SSL.
SSL page
Use this control to customize the report:
Time interval
Specifies a report time interval of 5 minutes (5m), 1 hour (1h), 1 day (1d), 1 week (1w), All, or type a custom date. All includes statistics for the last 30 days. Time intervals that don’t apply to a particular report are dimmed.
For a custom time interval, enter the start time and end time using the format yyyy/mm/dd hh:mm:ss
You can view the newest data and see data points as they’re added to the chart dynamically. To display the newest data, click Show newest data.