About the CPU Utilization report
The CPU Utilization report summarizes the percentage of all of the CPU cores used in the system within the time period specified. You can display individual cores or an overall average, or both.
General usage guidelines
Typically, an appliance operates on approximately 30 to 40 percent CPU capacity during nonpeak hours and approximately 60 to 70 percent capacity during peak hours. No single appliance CPU usage should exceed 90 percent.
The CPU Utilization report answers these questions:
• How much of the CPU is being used?
• What is the average and peak percentage of the CPU being used?
About report graphs
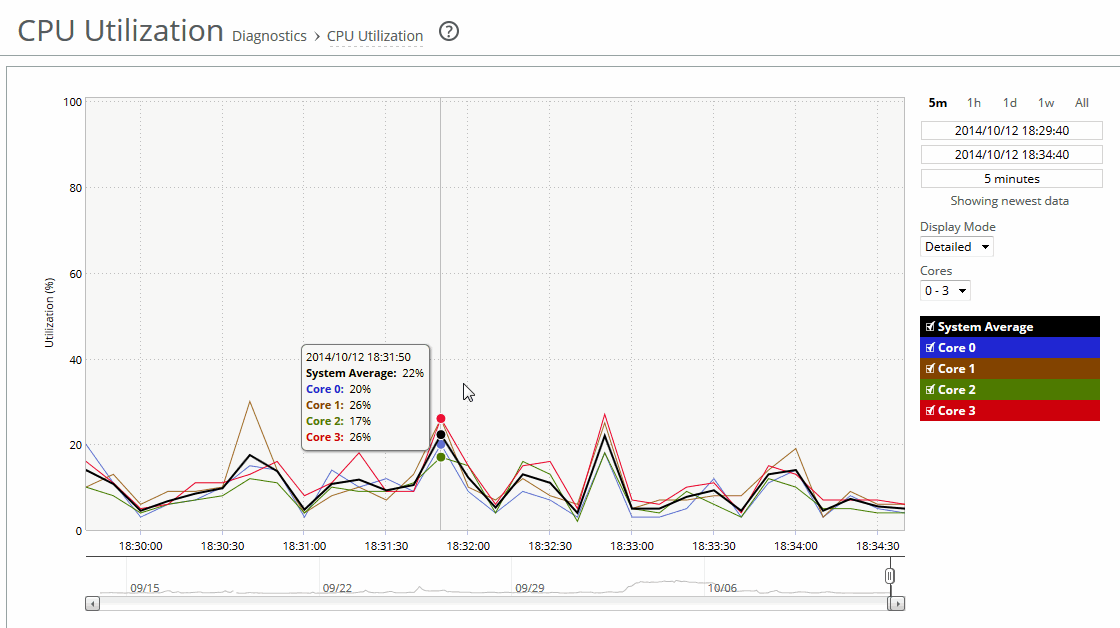
Mouse over a specific data point to see the values and exact time stamp.
Viewing the CPU Utilization report
You view the CPU Utilization report under Appliance > Diagnostics: CPU Utilization.
CPU Utilization page
Use these controls to customize the report:
Time Interval
Specifies a report time interval of 5 minutes (5m), 1 hour (1h), 1 day (1d), 1 week (1w), All, or type a custom date. All includes statistics for the last 30 days. Time intervals that don’t apply to a particular report are dimmed.
For a custom time interval, enter the start time and end time using the format yyyy/mm/dd hh:mm:ss
You can quickly see the newest data and see data points as they’re added to the chart dynamically. To display the newest data, click Show newest data.
Display Mode
Specifies one of these displays from the drop-down list:
• Brief displays the CPU utilization percentage of all CPU cores combined as a systemwide average.
• Detailed displays the CPU percentages for each RiOS core individually. The individual cores appear with a number and a color in the data series. To hide or display a core in the plot area, select or clear the check box next to the core name.