About the HTTP report
The HTTP report displays the hit rates for HTTP optimization for the time period specified.
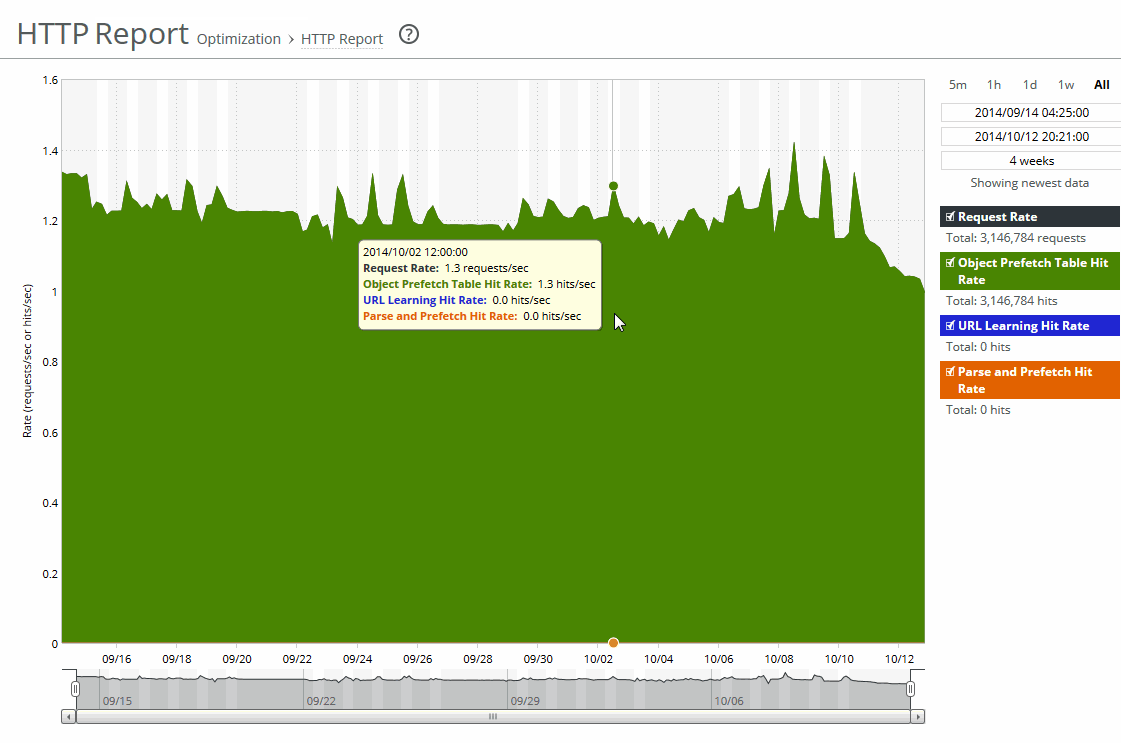
The HTTP report graph displays these statistics that summarize HTTP data activity:
Request Rate
Displays the rate of HTTP objects, URLs, and object prefetch requests.
Object Prefetch Table Hit Rate
Displays the hit rate of stored object prefetches per second. The appliance stores object prefetches from HTTP GET requests for cascading style sheets, static images, and Java scripts in the Object Prefetch Table.
URL Learning Hit Rate
Displays the hit rate of found base requests and follow-on requests per second. The appliance learns associations between a base request and a follow-on request. Instead of saving each object transaction, the appliance saves only the request URL of object transactions in a Knowledge Base and then generates related transactions from the list.
Parse and Prefetch Hit Rate
Displays the hit rate of found and prefetched embedded objects per second. The appliance determines which objects are going to be requested for a given web page and prefetches them so that they are readily available when the client makes its requests.
The navigator shadows the object prefetch table hit rate series.
The HTTP report answers this question:
• How many HTTP objects were obtained and transmitted over the WAN?
About report graphs
Mouse over a specific data point to see what the y values and exact time stamp were in relation to peaks.
About report data
The Riverbed system reports on performance for periods up to one month. Due to performance and disk space considerations, the display granularity decreases with time passed since the data was sampled. The data is collected at a 5-minute granularity for the entire month.
Viewing the HTTP report
You view the HTTP report under Optimization: Reports > HTTP.
HTTP page
Use this control to customize the report:
Time interval
Specifies a report time interval of 5 minutes (5m), 1 hour (1h), 1 day (1d), 1 week (1w), All, or type a custom date. All includes statistics for the last 30 days. Time intervals that do not apply to a particular report are dimmed.
For a custom time interval, enter the start time and end time using the format yyyy/mm/dd hh:mm:ss.
You can view the newest data and see data points as they are added to the chart dynamically. To display the newest data, click Show newest data.