About the Initiator I/O report
The Initiator I/O report summarizes the standard I/O data traffic read from and written by the selected initiator for the specified period of time.
An initiator is the branch-side client that sends SCSI I/O commands to the iSCSI target on the Edge. The Initiators maintain multiple sessions to the iSCSI targets. Each initiator has a unique name.
The Initiator I/O report answers these questions:
• How many bytes have been written to and read by the selected initiator for the specified period?
• How many operations have been written to and read by the selected initiator for the specified period?
• What are the average read and write latencies for the selected initiator for the specified period?
About report graphs
Mouse over a specific data point to see what the y values and exact time stamp were in relation to peaks.
About report data
The Riverbed system reports on performance for periods up to one month. Due to performance and disk space considerations, the display granularity decreases with time passed since the data was sampled.
Viewing the Initiator I/O report
You view the Initiator I/O report under Storage > Reports: Initiator I/O.
Initiator I/O page
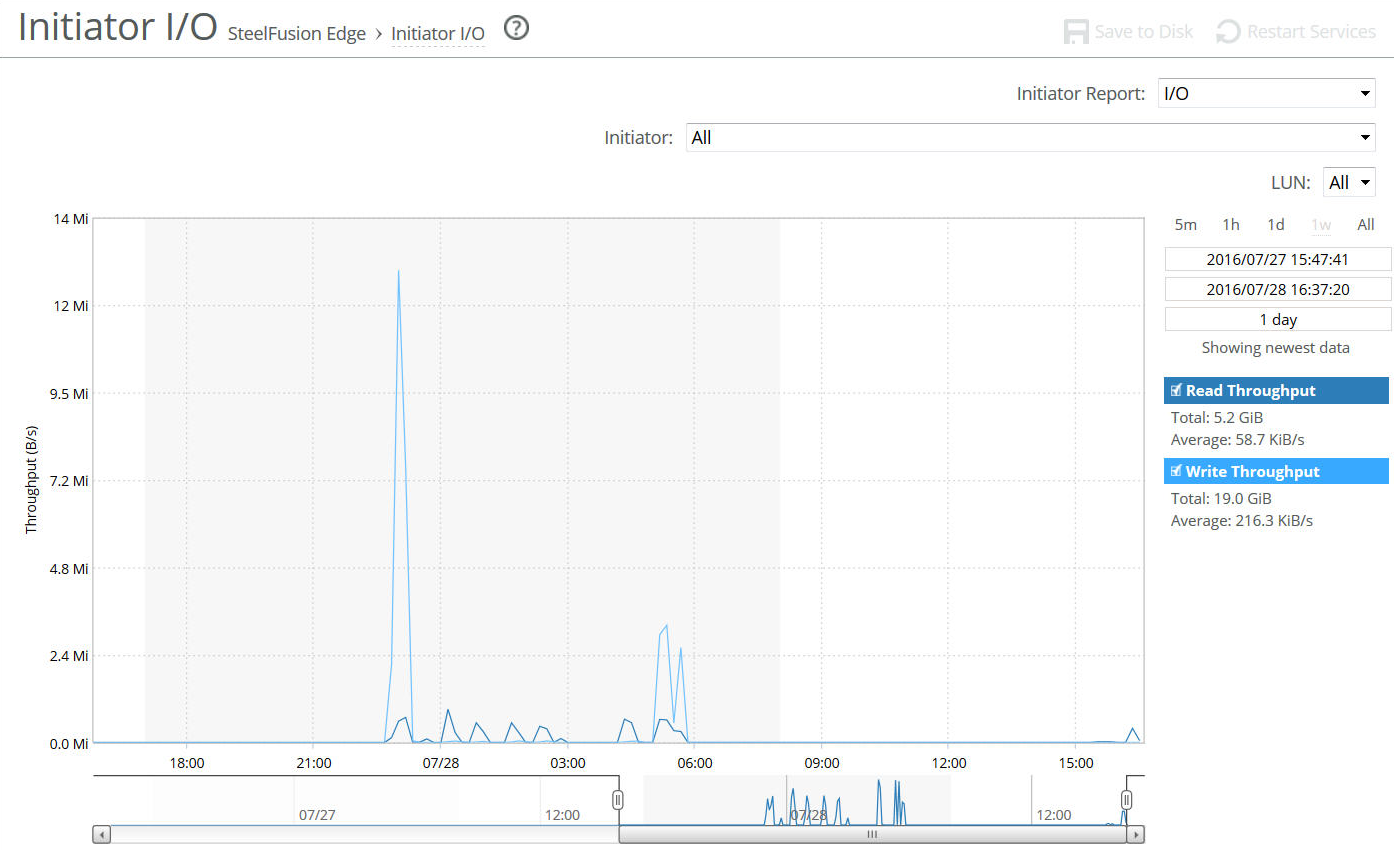
Use these controls to customize the report:
Time Interval
Specifies a report time interval of 5 minutes (5m), 1 hour (1h), 1 day (1d), 1 week (1w), All, or type a custom date. All includes statistics for the last 30 days. Time intervals that do not apply to a particular report are dimmed and unavailable.
For a custom time interval, enter the start time and end time using the format yyyy/mm/dd hh:mm:ss.
Because the system aggregates data on the hour, request hourly time intervals. For example, setting a time interval to 08:30:00 to 09:30:00 from two days ago does not create a data display, whereas setting a time interval to 08:00:00 to 09:00:00 from two days ago will display data.
When you request a custom time interval to view data beyond the aggregated granularity, the data is not visible because the system is no longer storing the data. For example, the following custom time intervals do not return data because the system automatically aggregates data older than seven days into two-hour data points:
• Setting a one-hour time period that occurred two weeks ago.
• Setting a 75-minute time period that occurred more than one week ago.
You can quickly see the newest data and see data points as they are added to the chart dynamically. To display the newest data, click Show newest data.
Initiator
Specifies the initiator whose statistics you want to see from the drop-down list or select All to view all initiators.
The initiators listed in the drop down list will contain All and only configured initiators. Any connected initiator that is not configured is represented by All.
LUN
Specifies the LUN from the drop-down list or All to view all LUNs.
Initiator Report
Specifies I/O, I/O Ops Per Second, or I/O latency from the drop-down list.