About the Blockstore SSD Read Cache report
The blockstore is a feature of the Edge device installed at the branch-end of the WAN connection (typically included inside a Core at the branch site). The blockstore is an on-disk local cache that mirrors the complete persistent storage on the Core-side LUNs. The blockstore manages the block pages in the system. It reads block pages as needed, and writes block pages as they are scheduled to flush back through the Core.
The Blockstore Metrics report provides information on how well the Edge keeps up with the Core blockstore transfers, both in terms of time as well as the amount of uncommitted bytes. Blockstore metrics appear only on an Edge appliance.
The read cache and Blockstore SSD Read Cache report is only available on Edge 3100 and higher.
The Blockstore SSD Read Cache report answers these questions:
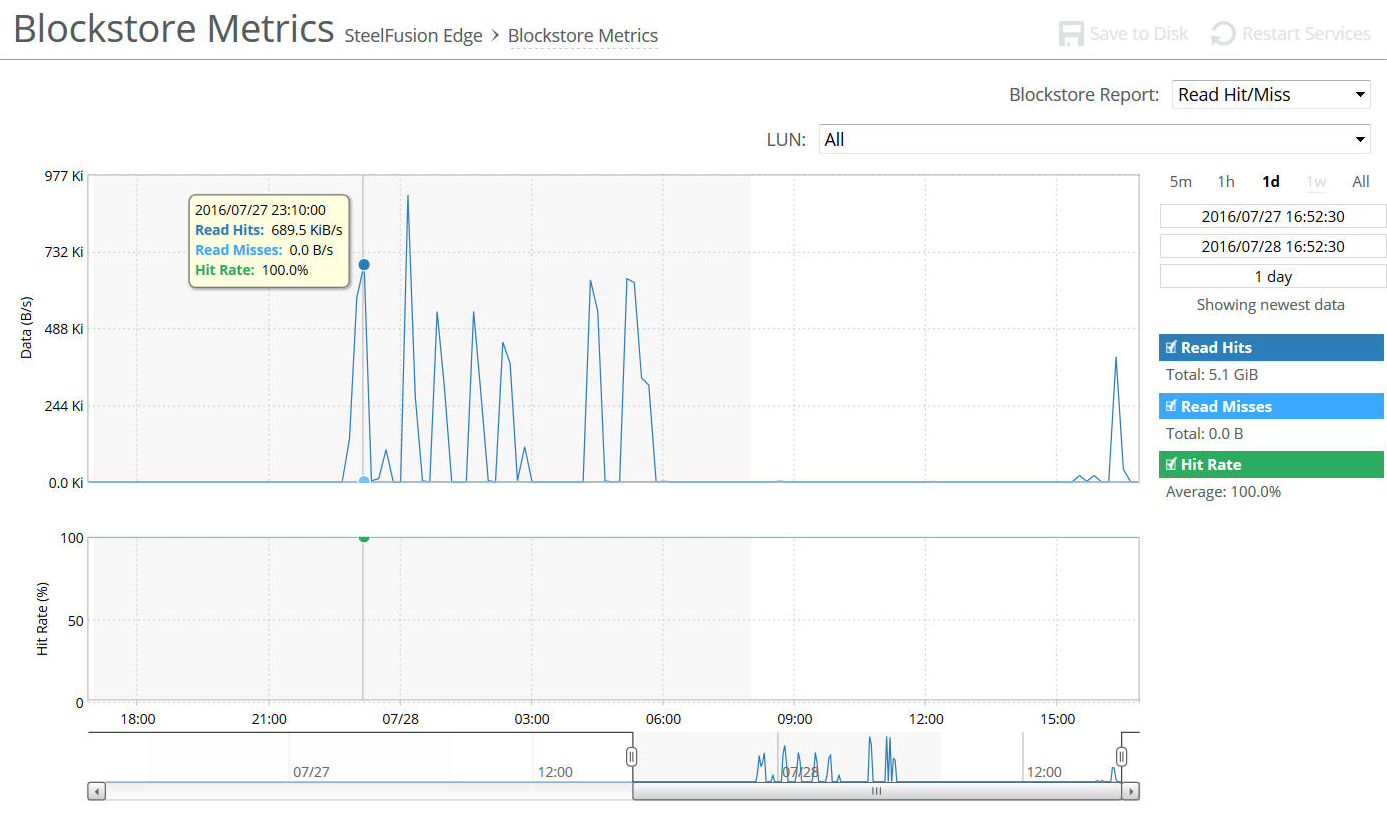
• How many read hits and misses were recorded for the blockstore for the selected LUN for the specified period?
• What is the hit ratio percentage for the selected LUN for the specified period?
About report graphs
Mouse over a specific data point to see what the y values and exact time stamp were in relation to peaks.
About report data
The Riverbed system reports on performance for periods up to one month. Due to performance and disk space considerations, the display granularity decreases with time passed since the data was sampled.
Viewing the Blockstore SSD Read Cache report
You view the Blockstore SSD Read Cache report under Storage > Reports: Blockstore SSD Read Cache.
Blockstore SSD Read Cache page
Use these controls to customize the report:
Time Interval
Specifies a report time interval of 5 minutes (5m), 1 hour (1h), 1 day (1d), 1 week (1w), All, or type a custom date. All includes statistics for the last 30 days. Time intervals that do not apply to a particular report are dimmed and unavailable.
For a custom time interval, enter the start time and end time using the format yyyy/mm/dd hh:mm:ss.
Because the system aggregates data on the hour, request hourly time intervals. For example, setting a time interval to 08:30:00 to 09:30:00 from two days ago does not create a data display, whereas setting a time interval to 08:00:00 to 09:00:00 from two days ago will display data.
When you request a custom time interval to view data beyond the aggregated granularity, the data is not visible because the system is no longer storing the data. For example, the following custom time intervals do not return data because the system automatically aggregates data older than seven days into two-hour data points:
• Setting a one-hour time period that occurred two weeks ago.
• Setting a 75-minute time period that occurred more than one week ago.
LUN
Specifies the LUN whose statistics you want to see from the drop-down list or select All to view all LUNs.