About the Data Store Disk Load report
The Data Store Disk Load report summarizes the RiOS data store disk load due to SDR only as related to the benchmarked capacity of the RiOS data store. Consider any value under 90 as healthy. Any value higher than a sustained load over 90 is considered high and might indicate disk pressure. A red line with shading appears at the top of the report to indicate the threshold of 90 and above. When a value is consistently higher than 90, contact Riverbed Support for guidance on reconfiguring the RiOS data store to alleviate disk pressure.
The report contains this statistic that summarizes the RiOS data store disk load.
The Data Store Disk Load report answers these questions:
• Is there any indication of disk pressure?
• What is the disk load at different times of the day?
Viewing the Data Store Disk Load report
You view the Data Store Disk Load report under Reports > Optimization: Data Store Disk Load.
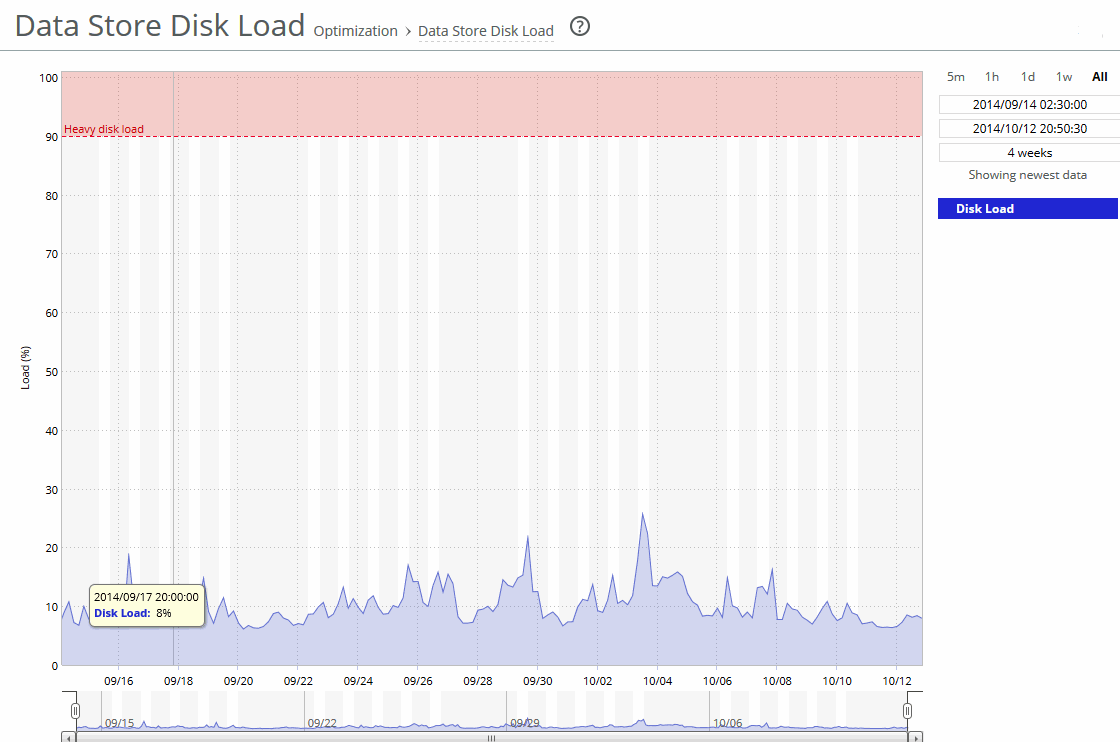
Data Store Disk Load page
Use this control to customize the report:
Time Interval
Specifies a report time interval of 5 minutes (5m), 1 hour (1h), 1 day (1d), 1 week (1w), All, or type a custom date. All includes statistics for the last 30 days. Time intervals that don’t apply to a particular report are dimmed.
For a custom time interval, enter the start time and end time using the format yyyy/mm/dd hh:mm:ss.
You can quickly see the newest data and see data points as they’re added to the chart dynamically. To display the newest data, click Show newest data.