About the Application Visibility report
The Application Visibility report summarizes the traffic flowing through an appliance classified by the application for the time period specified. This report provides application level visibility into layer-7 and shows the application dynamics for pass-through and optimized traffic.
You must enable application visibility under Networking > Network Services: Flow Statistics before the Application Visibility report can gather and display statistics. Application Visibility is enabled by default. This report does not include IPv6 traffic.
The Application Visibility report includes these statistics for each listed application, traffic direction, and the time period you specify:
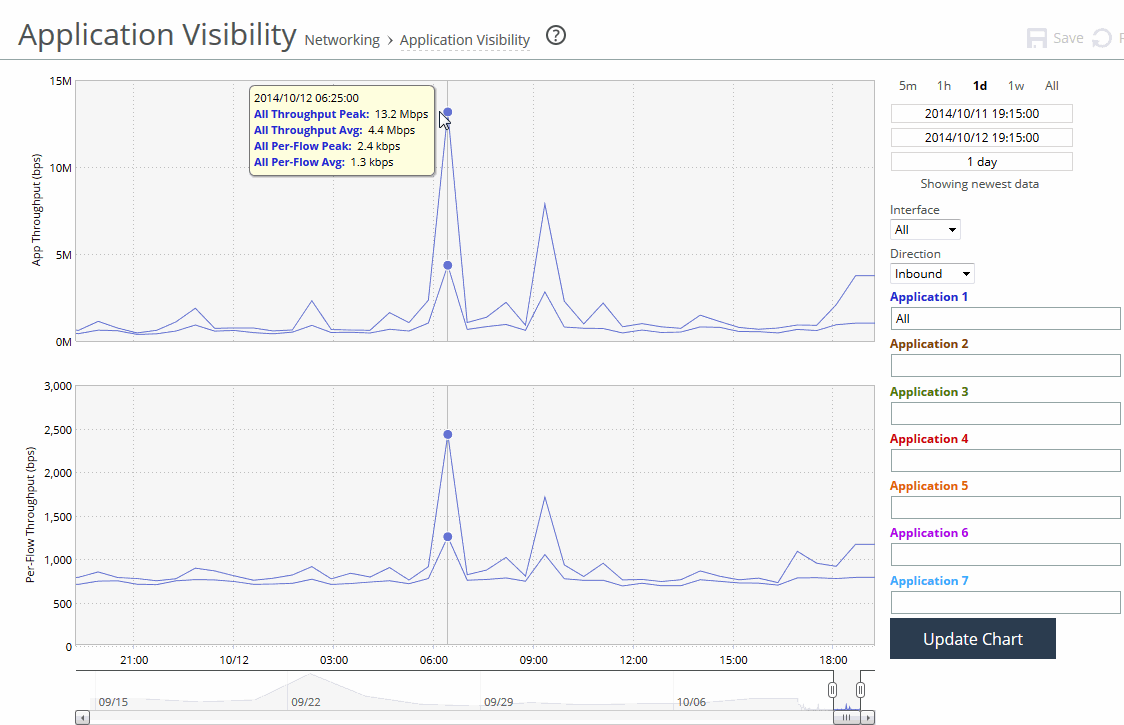
App Throughput
Displays the throughput for all traffic flows in bits per second. The minimum sample granularity is 5 minutes.
• Throughput Peak—Mouse over the data series to display the peak data activity in bits per second. For larger granularity data points, this represents the largest 5 minute average within. For 5 minutes, this is the same as the average.
• Throughput Average—Mouse over the data series to display the average trended throughput for all traffic flows in kbps.
Per-Flow Throughput
Displays the throughput per traffic flow in bits per second.
• Per-Flow Peak—Mouse over the data series to display the peak trended data activity per traffic flow in bits per second. This peak is the largest per flow 5-minute bps within a larger sample.
• Per-Flow Average—Mouse over the data series to display the average trended throughput in all traffic flows of an application in bits per second. This data series indicates how bandwidth-intensive an application is per user or flow.
RiOS calculates the WAN average at each data point by taking the number of bytes transferred, converting that to bits, and then dividing by the granularity.
For instance, if the system reports 100 bytes for a data point with a 10-second granularity, RiOS calculates:
100 bytes * 8 bits/byte / 10 seconds = 80 bps
This calculation means that 80 bps was the average throughput over that 10-second period.
The navigator shadows the Per-flow throughput series.
The Application Visibility report answers this question:
• How much bandwidth is a particular application using?
About report graphs
Mouse over a specific data point to see what the y values and exact time stamp were in relation to peaks.
About report data
The Riverbed system reports on performance for periods up to one month. Due to performance and disk space considerations, the display granularity decreases with time passed since the data was sampled. The data is collected at a 5-minute granularity for the entire month.
Viewing the Application Visibility report
You view the Application Visibility report under Networking: Reports > Application Visibility.
Application Visibility page
Use these controls to change the report display:
Time interval
Specifies a report time interval of 5 minutes (5m), 1 hour (1h), 1 day (1d), 1 week (1w), All, or type a custom date. All includes statistics for the last 30 days. Time intervals that don’t apply to a particular report are dimmed.
For a custom time interval, enter the start time and end time using the format yyyy/mm/dd hh:mm:ss.
You can view the newest data and see data points as they’re added to the chart dynamically. To display the newest data, click Show newest data.
Interface
Specifies an interface from the drop-down list. The default is all interfaces.
Direction
Specifies the traffic direction from the drop-down list. The default is outbound LAN > WAN traffic.
Application Name
Displays the application name. Type the first characters in the application name. When the application name and definition appears, select it from the list. You can select up to seven applications.
Click Update Chart to update the chart without changing the application selection.