About the System Details report
The System Details report takes a current snapshot of the system to provide a one-stop report you can use to check for any issues with the appliance. The report examines key system components. For example, the CPU and memory. Use this report to gather preliminary system information before calling Riverbed Support to troubleshoot an issue.
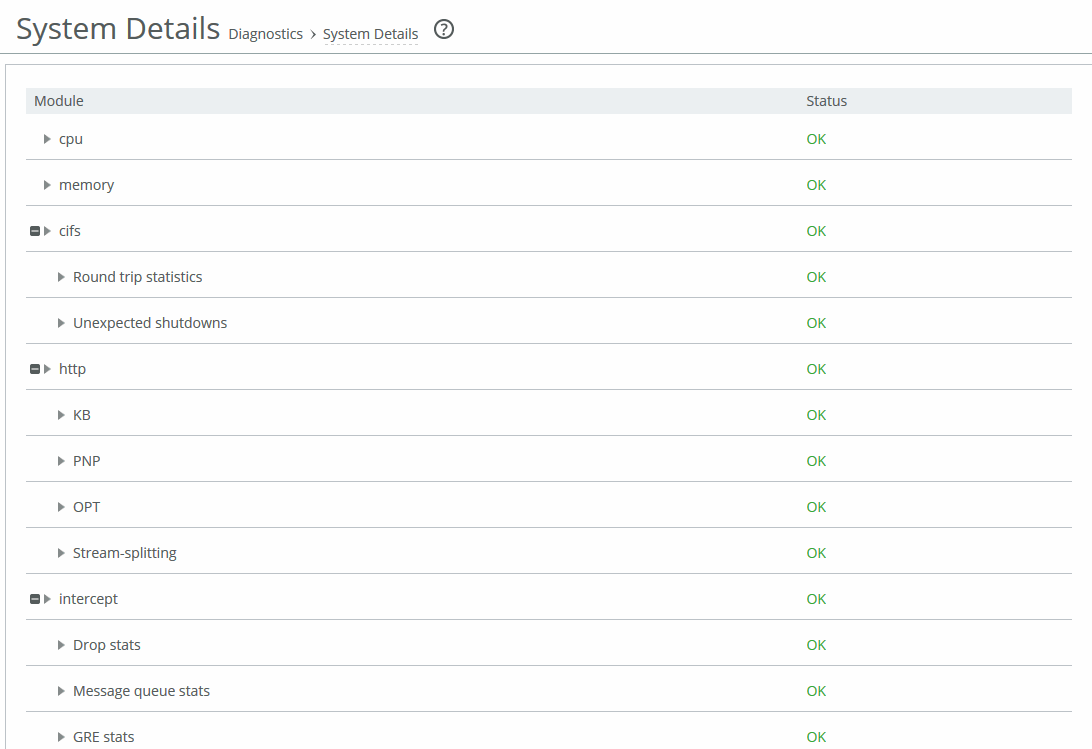
Module
Displays the Edge module. Select a module name to view details. A right arrow to the left of a module indicates that the report includes detailed information about a submodule. Click the arrow to view submodule details.
This report examines these modules:
CPU
Displays information about idle time, system time, and user time per CPU.
Memory
Displays information about the total, used, and free memory by percentage and in kilobytes.
CIFS
Displays details for unexpected shutdowns and round-trip statistics. Click the right arrow and the submodule.
HTTP
Displays details for the URL Learning, Parse and Prefetch, and Object Prefetch Table optimization schemes. Click the right arrow and the submodule name.
Intercept
Displays statistics for message queue, GRE, and WCCP. Also includes table length and watchdog status. Click the right arrow.
Lotus Notes
Displays whether Lotus Notes optimization is enabled.
MAPI
Displays these details. Click the right arrow and the submodule name.
• Accelerators displays how many accelerator objects have been created for read-ahead, write-behind, and cached-mode folder synchronization. One accelerator object corresponds to the optimization of one particular Outlook action.
Read-ahead is for downloading an email attachment (in noncached Outlook mode or for public folders).
Write-behind is for uploading an email attachment.
Cache-sync is for downloading the new contents of a folder (in cached mode).
• Requests and responses displays the number of MAPI round trips used and saved. Includes the number of responses and faults along with the fault reason: for example, access denied.
• MAPI decryption and encryption (RPCCR) displays whether MAPI decryption and encryption is enabled. Includes the number of client-side and server-side appliance encrypted MAPI sessions, along with details about how many sessions were not encrypted, how many sessions were successfully decrypted and encrypted, how many sessions were passed through, and how many sessions experienced an authentication failure.
• Connection sessions displays the number of client-side and server-side appliance MAPI sessions, counting the number of MAPI 2000, 2003, 2007, and pass-through sessions.
Oracle Forms
Displays details for native and HTTP mode key. Click the right arrow and submodule name.
Secure Peering
Displays details for secure inner channels, including information about certificate and private key validity, peer SteelHead trust, and blacklisted servers. Click the right arrow and submodule name.
Splice Policy
Displays details about the splice policy in use.
SSL
Displays whether SSL optimization is enabled and details about the SSL configuration, such as which advanced settings are in use. Click the right arrow and the submodule name to view details for the SSL outer and inner channels.
Status
Displays one of these results:
• OK (Green)
• Warning (Yellow)
• Error (Red)
• Disabled (Gray). Appears when you manually disable the module.
The System Details report answers this question:
• Is there a problem with one particular application module or does the issue affect multiple modules?
Viewing the System Details report
You view the System Details report under Administration > Diagnostics: System Details.
System Details page
To print the report, choose File > Print in your web browser to open the Print dialog box.