Viewing effective round-trip time statistics
Effective round-trip (ERTT) statistics help you to evaluate time savings provided by acceleration. These statistics help to measure how much accelerated application usage is sped up through data reduction and streamlining. ERTT is calculated as: ERTT = (WAN_Bytes / Local_LAN_Bytes) * WAN_RTT
Enable this report through the CLI by running this command: # stats profiler peer-stats enable.
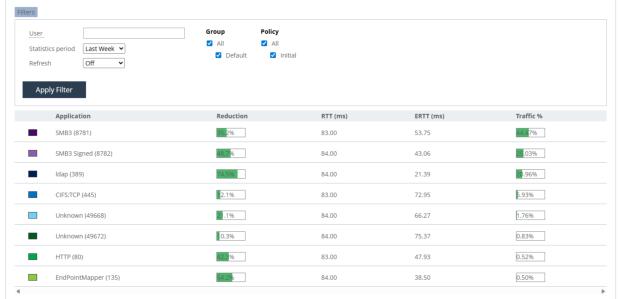
1. To view the ERTT report, choose Reports > Endpoints: Effective RTT (ERTT) to display the Effective RTT page. Click the Filters tab to access the controls to customize the report:
– User—Enter the name of a specific user to filter the results to that user. The search is not case-sensitive, you are allowed to enter multiple users separated by commas, and you can use wildcards. For the default report based on all endpoints connected to the controller leave the box empty.
– Statistics Period—Select Last Hour, Last Day, Last Week, Last Month, or Custom from the drop-down list. If you select Custom, specify a Start Time and End Time to configure a customized time interval report. Use this format for specifying a start and end time: yyyy/mm/dd hh:mm:ss
– Refresh—Select a refresh rate option for the report display: 5, 10, or 15 Minutes. Alternatively, select Off to turn off refresh. The refresh rate sets the rate at which the results of polling are displayed, not the polling rate itself. Polling occurs every five minutes.
2. Select or clear the check boxes for these controls:
– Group—Select the controller groups to display.
– Policy—Select the policies to display.
3. Click Apply Filter to display the customized report.
Effective Round-Trip Times (ERTT) report