Enabling Statistics Collection for Applications
You configure settings for statistics collection for applications in the Stats Collection page.
Note: This feature requires that you configure your topology and applications before you enable application statistics. This feature is considered to be a hybrid push.
When you enable the collection of statistics for applications, this setting provides the data for the Top Ten Applications report in the Dashboard and the Sites Details page. It also enables collection of statistics for individual applications in the Applications Details page.
Application statistics provides a separate byte count for optimized and pass-through traffic. The SteelHead aggregates the traffic and sends it to the SCC for display. Data is displayed in an hourly format over a 1 week period. You can view the top ten applications for all sites in the Dashboard or you can view data for individual sites in the Sites Details page.
Application statistics supports IPv4 in physical or virtual in-path deployments; application statistics is not supported for out-of-path deployments. Certain active-active serial cluster pass-through traffic might be counted multiple times because data is aggregated per site as opposed to a single appliance. Also data is reported hourly—it is not instantaneous. If you have a high number of sites reporting back to the SCC, viewing report data could take longer to display. Finally, data for default, built-in SCC applications is collected, data for custom applications is not collected.
Application statistics provide you with a summary of throughput of the top ten applications for optimized, pass-through, and combined (that is, optimized and pass through) traffic. Application statistics help you make optimization policy decisions and allocate resources appropriately.
Application statistics provides data for applications for up to one week. The units displayed are:
• bits/second and averages per hour for optimized, pass-through, and combined traffic.
• optimized and pass-through traffic which represents the WAN in and WAN out traffic.
• combined traffic which represents optimized traffic plus the pass-through traffic.
• each 1 K represents 1000 bits, not 1024 bits.
To configure statistics collection settings for applications
1. Choose Manage > App Definitions: Stats Collection to display the Applications page.
Figure: Enabling Statistics Collection for Applications
2. To enable collection of statistics for the Top Applications reports, click Enable Stats Collection.
3. Click Save to save your settings.
4. On the right-side of the page, under Policy Push Control, click Include in Push.
5. Under Push to Appliances, select Sites or Site Types that contains the SteelHead to which this configuration should be pushed.
To disable statistics collection at certain sites
1. Choose Manage > App Definitions: Stats Collection to display the Applications page.
2. Under Disable Stats Collection at Certain Sites, click + Add Exception to display the pop-up window.
Figure: Disabling Statistics Collection at Sites
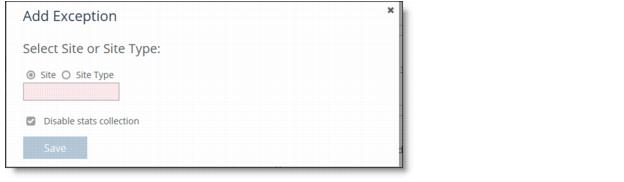
3. Select Site or Site Type and select a site or site type the from the drop down list.
4. Click Disable stats collection and click Save. The specified site of site type appears in the list.