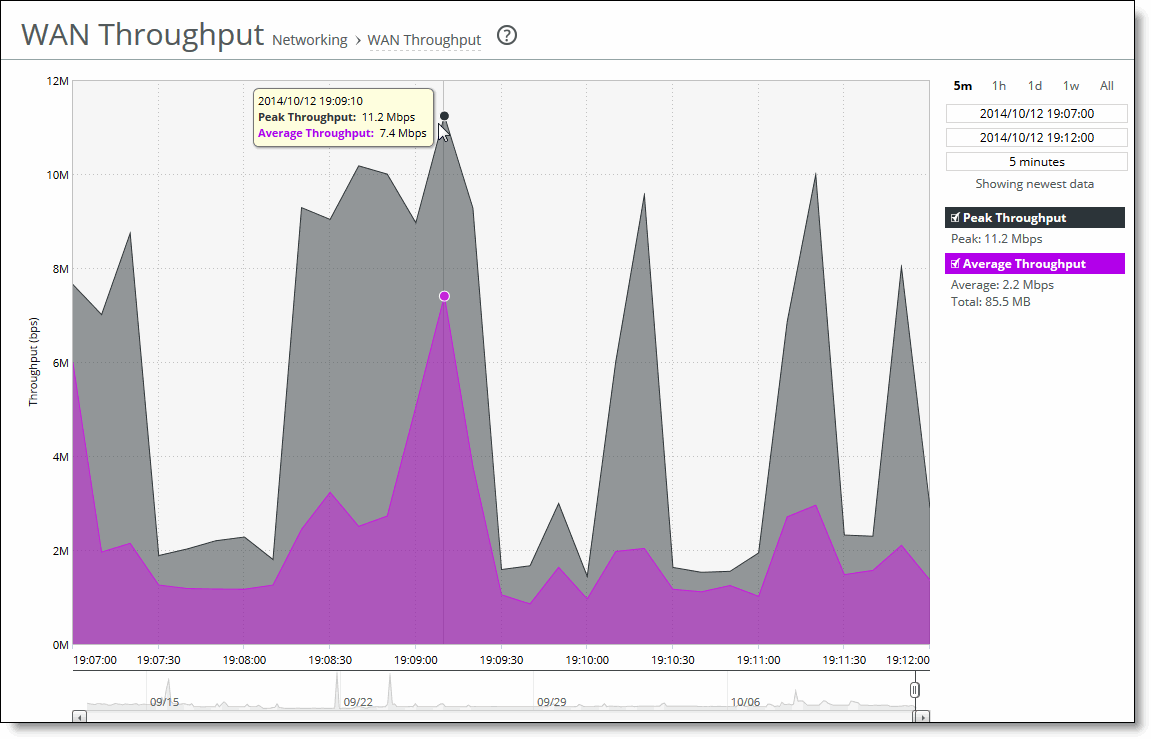
Viewing WAN Throughput Reports
The WAN Throughput report summarizes the WAN throughput for the time period specified. In standard in-path and virtual in-path deployments, the throughput is an aggregation of all data the system transmits out of all WAN interfaces. In a server-side out-of-path configuration, the report summarizes all data the system transmits out of the primary interface.
For details about the report format, see
Overview.
You must choose Networking > Network Services: Flow Statistics and enable WAN Throughput Statistics to view data in this report. WAN throughput statistics are enabled by default.
The WAN Throughput report doesn’t include any traffic that is hardware bypassed, either by an in-path interface in hardware bypass, or the portion of traffic that is bypassed by hardware-assist rules on supported Fiber 10 Gigabit-Ethernet in-path cards.
The WAN Throughput report includes a WAN link throughput graph that provides these statistics describing data activity for the time period you specify.
Data Series | Description |
Peak Throughput | Displays the peak data activity. |
Average Throughput | Displays the average and total throughput. RiOS calculates the WAN average at each data point by taking the number of bytes transferred, converting that to bits, and then dividing by the granularity. For instance, if the system reports 100 bytes for a data point with a 10-second granularity, RiOS calculates: 100 bytes * 8 bits/byte / 10 seconds = 80 bps This calculation means that 80 bps was the average throughput over that 10-second period. The total throughput shows the data amount transferred during the displayed time interval. The average that appears below the Average Throughput is an average of all displayed averages. |
The navigator shadows the Peak throughput series.
In some configurations, RiOS transmits LAN traffic out of WAN interfaces: for example, virtual in-path deployments and deployments using the default gateway on the WAN side without simplified routing. In such deployments, you can configure subnet side rules to decide which channel traffic isn’t destined for the WAN. For details, see
Configuring Subnet Side Rules.
What This Report Tells You
The WAN Throughput report answers these questions:
• What was the average WAN throughput?
• What was the peak WAN throughput?
About Report Graphs
Use the mouse to hover over a specific data point to see what the y values and exact time stamp were in relation to peaks.
About Report Data
The Riverbed system reports on performance for periods up to one month. Due to performance and disk space considerations, the display granularity decreases with time passed since the data was sampled with a granularity of 5 minutes for the day, 1 hour for the last week, and 2 hours for the rest of the month.
To view the WAN Throughput report
1. Choose Reports > Optimization: WAN Throughput to display the WAN Throughput page.
Figure: WAN Throughput Page

2. Use the controls to change the display as described in this table.
Control | Description |
Time interval | Select a report time interval of 5 minutes (5m), 1 hour (1h), 1 day (1d), 1 week (1w), All, or type a custom date. All includes statistics for the last 30 days. Time intervals that don’t apply to a particular report are dimmed. For a custom time interval, enter the start time and end time using the format YYYY/MM/DD HH:MM:SS. Because the system aggregates data on the hour, request hourly time intervals. For example, setting a time interval to 08:30:00 to 09:30:00 from 2 days ago doesn’t create a data display, whereas setting a time interval to 08:00:00 to 09:00:00 from 2 days ago will display data. When you request a custom time interval to view data beyond the aggregated granularity, the data is not visible because the system is no longer storing the data. For example, these custom time intervals don’t return data because the system automatically aggregates data older than 7 days into 2-hour data points: • Setting a 1-hour time period that occurred 2 weeks ago. • Setting a 75-minute time period that occurred more than 1 week ago. You can view the newest data and see data points as they’re added to the chart dynamically. To display the newest data, click Show newest data. |


