Viewing Data Store SDR-Adaptive Reports
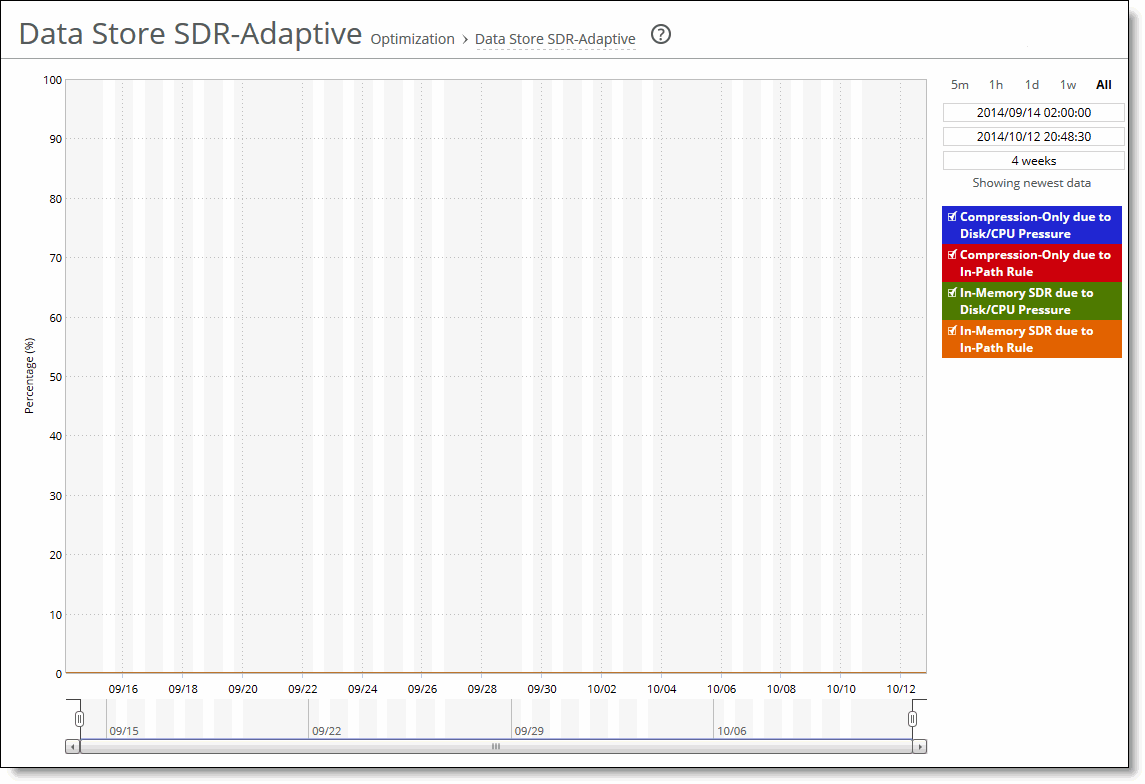
The Data Store SDR-Adaptive report summarizes:
• how much adaptive compression is occurring in the RiOS data store using legacy mode. The report combines the percentages due to both local and remote adaptive compression (as signaled by the peers).
• the percentage of the traffic, in bytes, that is adapted to in-memory-only (or transient), compared to the total SDR traffic (SDR-adaptive mode).
For details about the report format, see
Overview.
The report contains these statistics that summarize RiOS data store adaptive compression activity, shown as a percent of total SDR data.
Data Series | Description |
Compression-Only Due To Disk/CPU Pressure | Displays the adaptive compression occurring due to disk/CPU pressure. |
Compression-Only Due To In-Path Rule | Displays the adaptive compression occurring due to the in-path rule. |
In-Memory SDR Due To Disk/CPU Pressure | Displays the in-memory SDR due to disk/CPU pressure. |
In-Memory SDR Due To In-Path Rule | Displays the maximum in-memory SDR due to the in-path rule. |
The navigator shadows the compression-only due to disk/CPU pressure series.
What This Report Tells You
The Data Store SDR-Adaptive report answers this question:
• What’s the relative adaptive compression when SDR-Adaptive is enabled at various times of the day?
To view the Data Store SDR-Adaptive report
1. Choose Reports > Optimization: Data Store SDR-Adaptive to display the Data Store SDR-Adaptive page.
Figure: Data Store SDR-Adaptive Page

2. Use the controls to customize the report as described in this table.
Control | Description |
Time interval | Select a report time interval of 5 minutes (5m), 1 hour (1h), 1 day (1d), 1 week (1w), All, or type a custom date. All includes statistics for the last 30 days. Time intervals that don’t apply to a particular report are dimmed. For a custom time interval, enter the start time and end time using the format YYYY/MM/DD HH:MM:SS. You can view the newest data and see data points as they’re added to the chart dynamically. To display the newest data, click Show newest data. |


