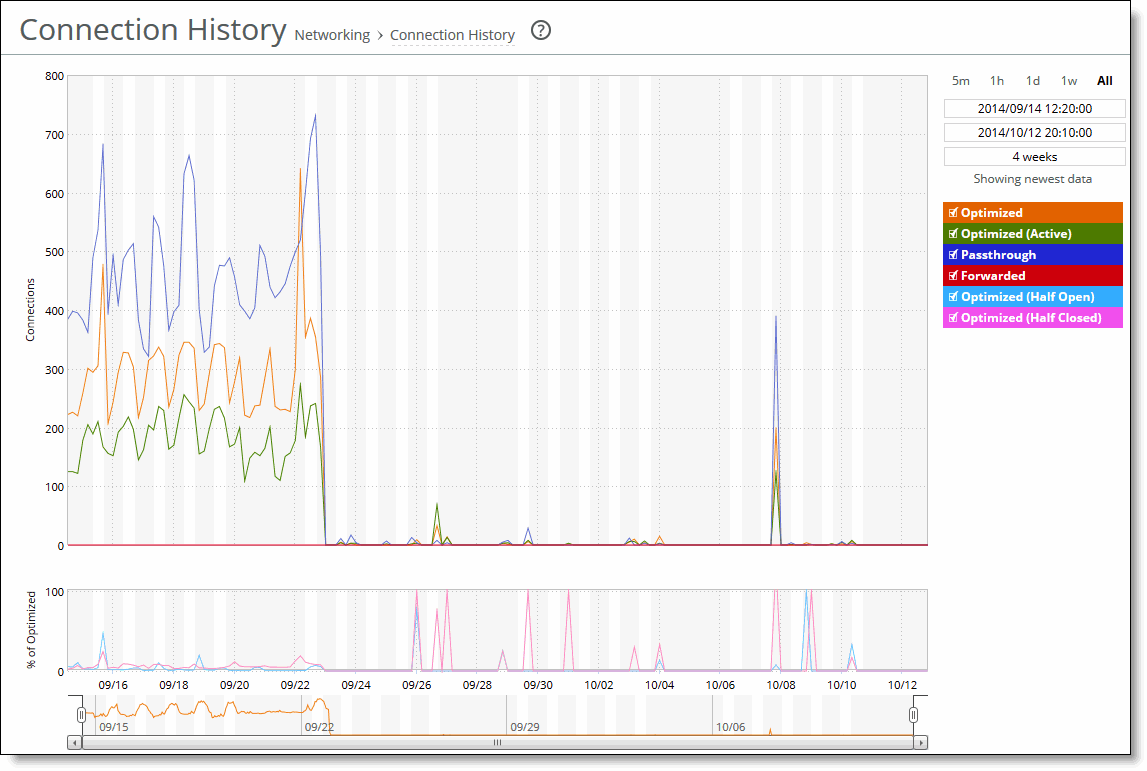
Figure: Connection History Page

Connection Type | Description |
Optimized | Displays the total connections, including half-open, half-closed (where half-open and half-closed are TCP connection states), idle, established and optimized. |
Optimized (Active) | Displays the total active connections that are established and optimized. |
Passthrough | Displays the total connections passed through unoptimized. |
Forwarded | Displays the total number of connections forwarded by the connection-forwarding neighbor managing the connection. |
Optimized (Half Open) | Displays the percentage of half-opened connections represented in the optimized connection total. A half-open connection is a TCP connection that has not been fully established. Half-open connections count toward the connection count limit on the SteelHead because, at any time, they might become a fully open connection. If you are experiencing a large number of half-opened connections, consider a more appropriately sized SteelHead. |
Optimized (Half Closed) | Displays the percentage of half-closed active connections represented in the optimized connection total. Half-closed connections are connections that the SteelHead has intercepted and optimized but are in the process of being disconnected. These connections are counted toward the connection count limit on the SteelHead. (Half-closed connections might remain if the client or server doesn’t close its connections cleanly.) If you are experiencing a large number of half-closed connections, consider a more appropriately sized SteelHead. |

Control | Description |
Time interval | Select a report time interval of 5 minutes (5m), 1 hour (1h), 1 day (1d), 1 week (1w), All, or type a custom date. All includes statistics for the last 30 days. Time intervals that don’t apply to a particular report are dimmed. For a custom time interval, enter the start time and end time using the format YYYY/MM/DD HH:MM:SS. You can view the newest data and see data points as they’re added to the chart dynamically. To display the newest data, click Show newest data. |