Capturing and Uploading TCP Dump Files
You can create, download, and upload TCP capture files in the Reports > Diagnostics: TCP Dumps page.
Capture files contain summary information for every Internet packet received or transmitted on the interface to help diagnose problems in the system.
RiOS provides an easy way to create and retrieve multiple capture files from the Management Console. You can create capture files from multiple interfaces at the same time, limit the size of the capture file, and schedule a specific date and time to create a capture file. Scheduling and limiting a capture file by time or size allows unattended captures.
Note: You can’t upload a capture file to the SteelHead using Packet Analyzer.
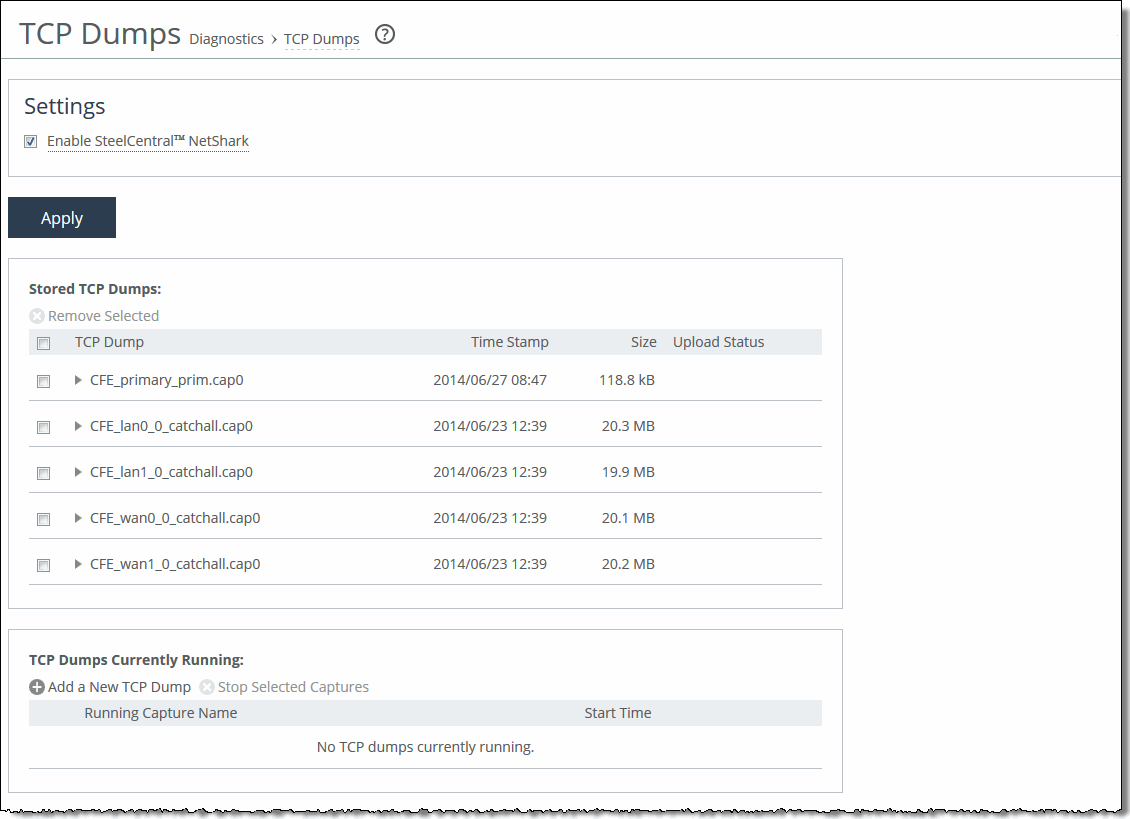
The top of the TCP Dumps page displays a list of existing capture files and the bottom of the page displays controls to create a capture file. The bottom of the page also includes the capture files that are currently running, and controls to create a trigger that stops a capture when a specific event occurs. The Running Capture Name list includes captures running at a particular time. It includes captures started manually and also any captures that were scheduled previously and are now running.
To capture TCP dumps
1. Choose Reports > Diagnostics: TCP Dumps to display the TCP Dumps page.
Figure: TCP Dumps Page

2. Complete the configuration as described in this table.
Control | Description |
Add a New TCP Dump | Displays the controls for creating a TCP trace dump. |
Capture Name | Specify the name of the capture file. The default filename uses the following format: hostname_interface_timestamp.cap Where hostname is the hostname of the SteelHead, interface is the name of the interface selected for the trace (for example, lan0_0, wan0_0), and timestamp is in the YYYY-MM-DD-HH-MM-SS format. If this trace dump relates to an open Riverbed Support case, specify the capture filename case_number where number is your Riverbed Support case number. For example, case_12345. Note: The .cap file extension is not included with the filename when it appears in the capture queue. |
Capture Traffic Between | IPs - Specify the source IP addresses. Separate multiple IP addresses with a comma to include all addresses bidirectionally. The default setting is all IP addresses. Ports - Specify the source ports. Separate multiple ports with a comma. The default setting is all ports. and: IPs - Specify the destination IP addresses. Separate multiple IP addresses with a comma to include all addresses bidirectionally. The default setting is all IP addresses. Ports - Specify the destination ports. Separate multiple ports with a comma. The default setting is all ports. |
Capture Interfaces | Captures the TCP trace dump on the selected interface(s). You can select all interfaces or a physical, MIP, SCA, VSP, or miscellaneous interface. The default setting is none. You must specify a capture interface. If you select several interfaces at a time, the data is automatically placed into separate capture files. |
Capture Duration (Seconds) | Specify how long the capture runs, in seconds. The default value is 30. Leave this value blank to initiate a continuous trace. When a continuous trace reaches the maximum space allocation of 100 MB, the oldest file is overwritten. |
Maximum Capture Size (MB) | Specify the maximum capture file size in MBs. The default value is 100. The recommended maximum capture file size is 1024 MBs (1 GB). |
Buffer Size | Optionally, specify the maximum number of packets allowed to queue up while awaiting processing by the TCP trace dump. The default value is 154. |
Snap Length | Optionally, specify the snap length value for the trace dump. Specify 65535 for a full packet capture (recommended for CIFS, MAPI, and SSL traces). The default value is 1518. |
Number of Files to Rotate | Specify how many TCP trace dump files to rotate. The default value is 5. |
Only Capture VLAN Packets | Captures only VLAN-tagged packets within a trace dump for a trunk port (802.1Q). Enabling this setting filters the trace dump by capturing only VLAN-tagged packets. This setting applies to physical interfaces only because logical interfaces (inpath0_0, mgmt0_0) do not recognize VLAN headers. |
Custom Flags | Specify custom flags to capture unidirectional traces. Examples: To capture all traffic to or from a single host host x.x.x.x To capture all traffic between a pair of hosts host x.x.x.x and host y.y.y.y To capture traffic between two hosts and two SteelHead inner channels: (host x.x.x.x and host y.y.y.y) or (host a.a.a.a and host b.b.b.b) |
Schedule Dump | Schedules the trace dump to run at a later date and time. |
Start Date | Specify a date to initiate the trace dump in the following format: YYYY/MM/DD |
Start Time | Specify a time to initiate the trace dump in the following format: HH:MM:SS |
Add | Adds the TCP trace dump to the capture queue. |
Troubleshooting
If your command results in a syntax error with an immediate or scheduled TCP dump, this message appears:
Error in tcpdump command. See System Log for details.
Review the system log to see the full tcpdump command attempt. Check the expression for issues such as a missing “and,” as well as contradictory instructions such as looking for VLAN-tagged traffic AND non-tagged traffic.
Custom Flag Use Examples
The examples in this table focus on the custom flag entry but rely on other fields to create a complete filter.
Filter Purpose | Custom Flag |
To capture all traffic on VLAN 10 between two specified endpoints: 1.1.1.1 and 2.2.2.2 | and vlan 10 |
To capture any packet with a SYN or an ACK | tcp[tcpflags] & (tcp-syn|tcp-ack) != 0 |
To capture any packet with a SYN | tcp[tcpflags] & (tcp-syn) != 0 —or— tcp[13] & 2 == 2 |
To capture any SYN to or from host 1.1.1.1 | and (tcp[tcpflags] & (tcp-syn) != 0) —or— and (tcp[13] & 2 == 2) |
IPv6 Custom Flag Use Examples
The examples in this table focus on the custom flag entry, but rely on other fields to create a complete filter.
To build expressions for TCP dump, IPv6 filtering doesn’t currently support the TCP, UDP, and other upper-layer protocol types that IPv4 does. Also, these IPv6 examples are based on the assumption that only a single IPv6 header is present.
Filter Purpose | Custom Flag |
To capture all FIN packets to or from host 2001::2002 | and (ip6[53] & 1!=0) |
To capture all IPv6 SYN packets | ip6 or proto ipv6 and (ip6[53] & 2 == 2) |
Stopping a TCP Dump After an Event Occurs
Capture files offer visibility into intermittent network issues, but the amount of traffic they capture can be overwhelming. Also, because rotating logs is common, after a capture logs an event, the SteelHead log rotation can overwrite debugging information specific to the event.
RiOS 8.5.x and later make troubleshooting easier because it provides a trigger that can stop a continuous capture after a specific log event occurs. The result is a smaller file to help pinpoint what makes the event happen.
The stop trigger continuously scans the system logs for a search pattern. When it finds a match, it stops all running captures.
To stop a capture after a specific log event
1. Choose Reports > Diagnostics: TCP Dumps to display the TCP Dumps page.
2. Schedule a capture.
Figure: TCP Dump Stop Trigger

3. In the Pattern text box, enter a Perl regular expression (regex) to find in a log. RiOS compares the Perl regex against each new line in the system logs and the trigger stops if it finds a match.
The simplest regex is a word or a string of characters. For example, if you set the pattern to “Limit,” the trigger matches the line “Connection Limit Reached.”
Notes:
• Perl regular expressions are case sensitive.
• Perl treats the space character like any other character in a regex.
• Perl reserves some characters, called metacharacters, for use in regex notation. The metacharacters are:
{ } [ ] ( ) ^ $ . | * + ? \
You can match a metacharacter by putting a backslash before it. For example, to search for a backslash in the logs, you must enter two backslashes (\\) as the pattern.
• The pattern follows Perl regular expression syntax. For details, go to:
• You can’t change the pattern while a scan is running. You must stop the scan before changing a pattern.
• You don’t need to wrap the pattern with the metacharacters to match the beginning or end of a line (^ $) or with the wildcard character (*).
4. Specify the amount of time to pause before stopping all running captures when RiOS finds a match. The time delay gives the system some time to log more data without abruptly cutting off the capture. The default is 30 seconds. Specify 0 for no delay; the capture stops immediately.
After a trigger has fired, the capture can stop by itself before the delay expires. For example, the capture duration can expire.
5. Click Start Scan.
When the scan stops, RiOS sends an email to all email addresses on the Administration: System Settings > Email page appearing under Report Events via Email. The email notifies users that the trigger has fired.
The page indicates “Last Triggered: Never” if a TCP Dump stop trigger has never triggered on the SteelHead. After the delay duration of the stop trigger, RiOS displays the last triggered time.
Before changing the Perl regular expression or amount of delay, you must first stop the process.
To stop a running scan
• Click Stop Scan to halt the background process that monitors the system logs. RiOS dims this button when the stop trigger is idling.
Stop Trigger Limitations
These limitations apply to the trigger:
• You can’t create a trigger to stop a specific capture; the trigger affects all running captures.
• If the search pattern contains a typo, the trigger might never find a match.
• Only one instance of a trigger can run at one time.
Viewing a TCP Dump
The top of the TCP Dumps page displays a list of existing captures.
To view a capture file
1. Choose Reports > Diagnostics: TCP Dumps to display the TCP Dumps page.
2. Under Stored TCP Dumps, select the capture name to open the file.
3. Click Download to view a previously saved capture file.
4. To remove a capture file, select the check box next to the name and click Remove Selected.
To print a capture file
1. Choose Reports > Diagnostics: TCP Dumps to display the TCP Dumps page.
2. Under Download Link, select the capture filename to open the file.
3. When the file opens, choose File > Print in your web browser to open the Print dialog box.
To stop a running capture
1. Choose Reports > Diagnostics: TCP Dumps to display the TCP Dumps page.
2. Select the capture filename in the Running Capture Name list.
3. Click Stop Selected Captures.
Uploading a TCP Dump
Riverbed offers a couple of ways to upload capture files to the support server for sharing with the support team while diagnosing issues.
To upload the capture file to Riverbed Support
1. In continuous mode, on the TCP Dumps page, select the running capture and click Stop Selected Captures.
For timed captures that are complete, skip to Step 2.
The capture appears as a download link in the list of Stored TCP Dumps.
2. Select the capture filename.
3. Optionally, specify a case number that corresponds to the capture. We recommend using a case number: for example, 194170.
To specify a URL instead of a case number, you must use the CLI. You can enter the CLI command file tcpdump upload URL. When you specify a URL, the capture file goes directly to the URL.
If the URL points to a directory on the upload server, it must have a trailing backslash (/).
For example:
ftp://ftp.riverbed.com/incoming/
(not ftp://ftp.riverbed.com/incoming)
The filename as it exists on the appliance will then match the filename on the upload server.
For details, see the Riverbed Command-Line Interface Reference Manual.
4. Click Upload.
Because uploading a capture file can take a while (especially when including ESXi information on a SteelHead EX), a progress bar displays the percentage of the total upload completed, the case number (if applicable), and the date and time the upload began. When the capture file finishes uploading, the date, time, and a status of either uploaded (appears in green) or failed (appears in red).
Successful uploads show the status, the case number (if applicable), and the date and time the upload finished.
For uploads that fail, an explanation, the case number (if applicable), and the upload starting date and time appear.


