Generating System Dumps
You can generate, display, and download system dumps in the System Dumps page. A system dump contains a copy of the kernel data on the system. System dump files can help you diagnose problems in the system.
To generate a system dump
1. Choose Reports > Diagnostics: System Dumps to display the System Dumps page.
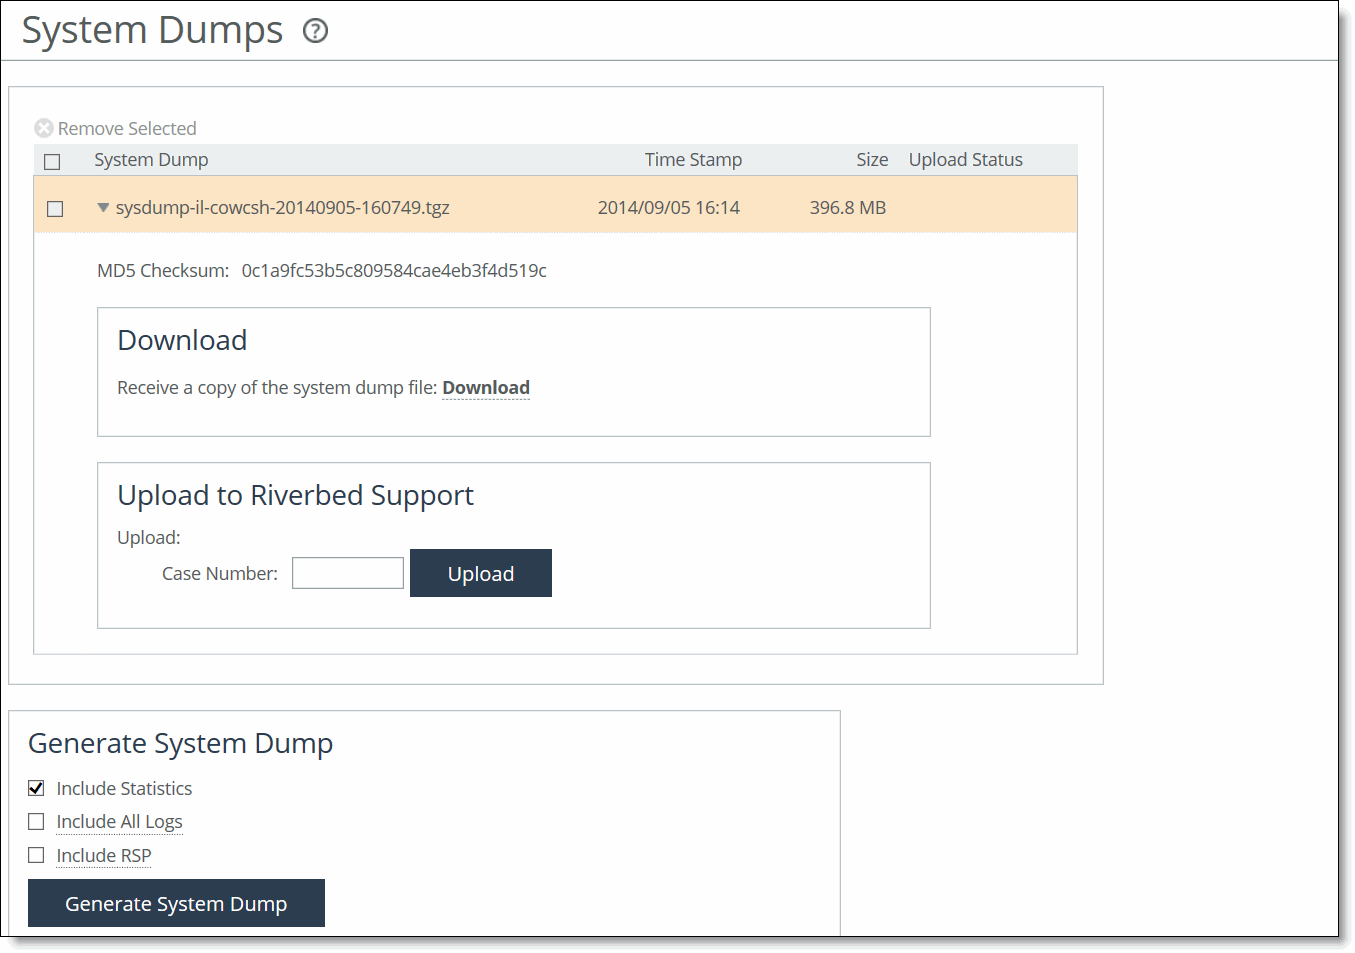
Figure: System Dumps Page

2. Under Generate System Dump, select the type of information to include in the report:
• Include Statistics - Select to collect and include CPU, memory, and other statistics in the system dump (this option is enabled by default). These statistics are useful while analyzing traffic patterns to correlate to an issue. The system adds the statistics to a file in the system dump called stats.tgz.
In RiOS 8.5.x and later, you can collect and include application visibility statistics in a compressed archive file called app_vis.db. For details, see
Viewing Application Visibility Reports.
• Include All Logs - Removes the 50 MB limit for compressed log files, to include all logs in the system dump.
• Include VSP - Collects and includes VSP ESXi information in the system dump.
3. Click Generate System Dump.
Because generating a system dump can take a while (especially when including ESXi information on a SteelHead EX), a spinner appears during the system dump creation. When the system dump is complete, its name appears in the list of links to download.
To view system dump files
1. Choose Reports > Diagnostics: System Dumps to display the System Dumps page.
2. Click Download to view a previously saved system dump.
3. Select the filename to open a file or save the file to disk.
4. To remove a log, check the box next to the name and click Remove Selected.
To print the report, choose File > Print in your web browser to open the Print dialog box.
To upload a system dump file to Riverbed support
1. Choose Reports > Diagnostics: System Dumps to display the System Dumps page.
2. Select the filename.
3. Optionally, specify a case number that corresponds to the system dump. We recommend using a case number: for example, 194170.
You can also enter the CLI command file debug dump upload URL to specify a URL instead of a case number. When you specify a URL, the dump file goes directly to the URL.
If the URL points to a directory on the upload server, it must have a trailing backslash (/).
For example:
ftp://ftp.riverbed.com/incoming/
(not ftp://ftp.riverbed.com/incoming)
The filename as it exists on the appliance will then match the filename on the upload server.
For details, see the Riverbed Command-Line Interface Reference Manual.
4. Click Upload.
Because uploading a system dump can take a while (especially when including ESXi information on a SteelHead EX), the status appears during the upload. When the system dump finishes uploading, the date, time, and a status of either uploaded (appears in green) or failed (appears in red). An explanation appears for uploads that fail.


