Viewing the NFS report
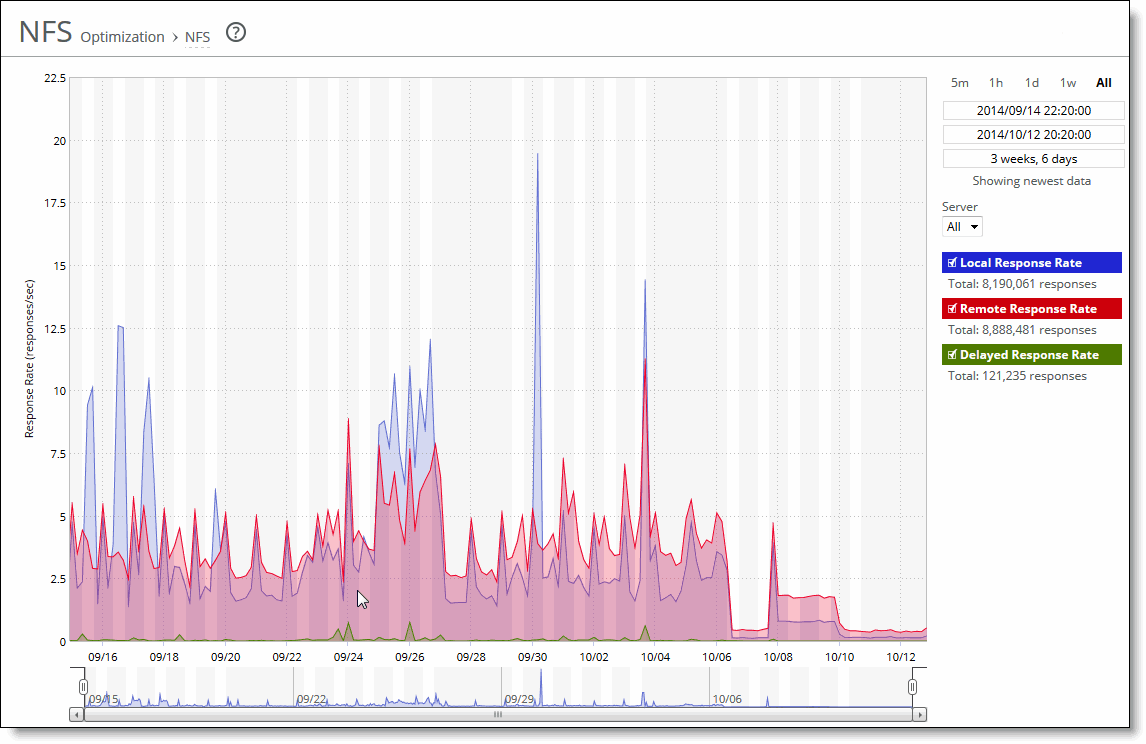
The NFS report shows the rates of responses for NFS optimizations for the time period specified. The NFS report contains these statistics that summarize NFS activity:
Local Response Rate displays the number of NFS calls that were responded to locally.
Remote Response Rate displays the number of NFS calls that were responded to remotely (that is, calls that traversed the WAN to the NFS server).
Delayed Response Rate displays the delayed calls that were responded to locally but not immediately (for example, reads that were delayed while a read ahead was occurring and that were responded to from the data in the read ahead).
The NFS report answers these questions:
• How many NFS calls were answered locally and remotely?
• How many delayed responses occurred for NFS activity?
Mouse over a specific data point to see what the y values and exact time stamp were in relation to peaks.
The Riverbed system reports on performance for periods up to one month. Due to performance and disk space considerations, the display granularity decreases with time passed since the data was sampled. The data is collected at a 5-minute granularity for the entire month.
You view the NFS report under Reports > Optimization: NFS.
NFS page
This option is available to customize the report:
Time interval specifies a report time interval of 5 minutes (5m), 1 hour (1h), 1 day (1d), 1 week (1w), All, or type a custom date. All includes statistics for the last 30 days. Time intervals that don’t apply to a particular report are dimmed. For a custom time interval, enter the start time and end time using this format: YYYY/MM/DD HH:MM:SS
You can view the newest data and see data points as they’re added to the chart dynamically. To display the newest data, click Show newest data.