Viewing the Live Video Stream Splitting report
Video stream splitting reduces the bandwidth consumption for both live video and video on demand (VoD). The Live Video Stream Splitting report lets you visually monitor the performance of the video session data optimized for multiple clients accessing the same video stream concurrently.
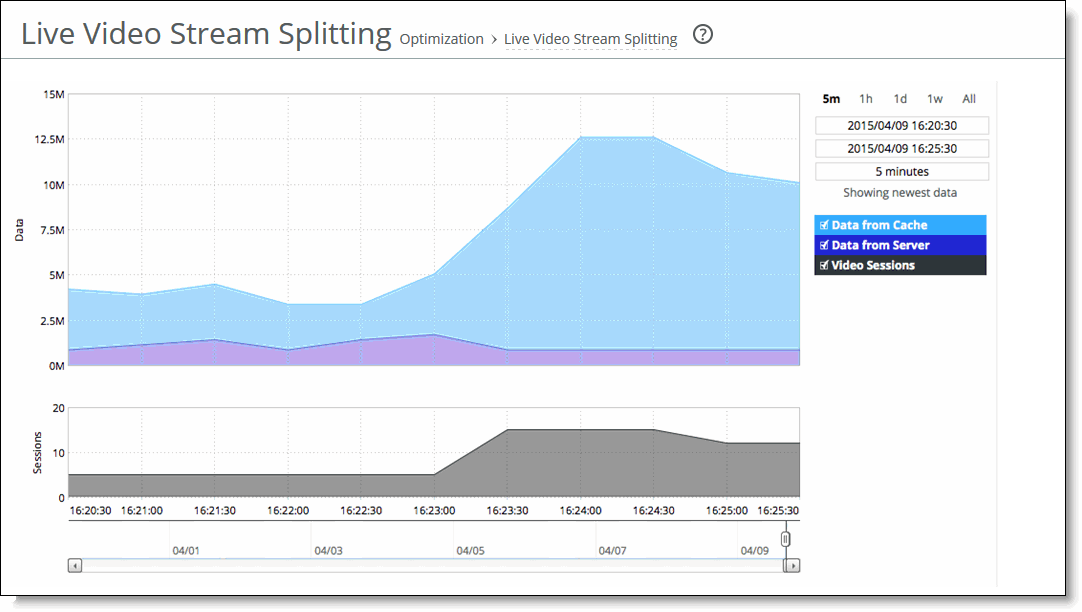
The SteelHead stores video fragments from a live video stream into a cache and sends the first request for a video fragment over the WAN, but stores the remaining fragments in the cache to serve locally. The report contains these statistics that summarize video split streaming activity:
Data From Cache displays the cumulative bps of video traffic served from the cache. Cache hits indicate that content is being served locally and avoiding round-trip bandwidth.
Data From Server displays the cumulative bps of video traffic going to and coming from the server over the WAN.
Video Sessions displays how many users are watching the video sessions. A video session is an open connection that has passed a video fragment.
The Live Video Stream Splitting report answers this question:
• How many live video streams have been optimized during the specified time period?
• How many users are watching the video sessions during the specified time period?
Mouse over a specific data point to see what the y values and exact time stamp were in relation to peaks.
The Riverbed system reports on performance for periods up to one month. Due to performance and disk space considerations, the display granularity decreases with time passed since the data was sampled. The data is collected at a 5-minute granularity for the entire month.
You view the Live Video Stream Splitting report under Reports > Optimization: Live Video Stream Splitting.
Live Video Stream Splitting page
This option is available to customize the report:
Time interval specifies a report time interval of 5 minutes (5m), 1 hour (1h), 1 day (1d), 1 week (1w), All, or type a custom date. All includes statistics for the last 30 days. Time intervals that don’t apply to a particular report are dimmed. For a custom time interval, enter the start time and end time using this format: YYYY/MM/DD HH:MM:SS
You can view the newest data and see data points as they’re added to the chart dynamically. To display the newest data, click Show newest data.