Viewing the Bandwidth Optimization report
The Bandwidth Optimization report summarizes the overall inbound and outbound bandwidth improvements on your network. You can create reports according to the time period, port, and traffic direction of your choice.
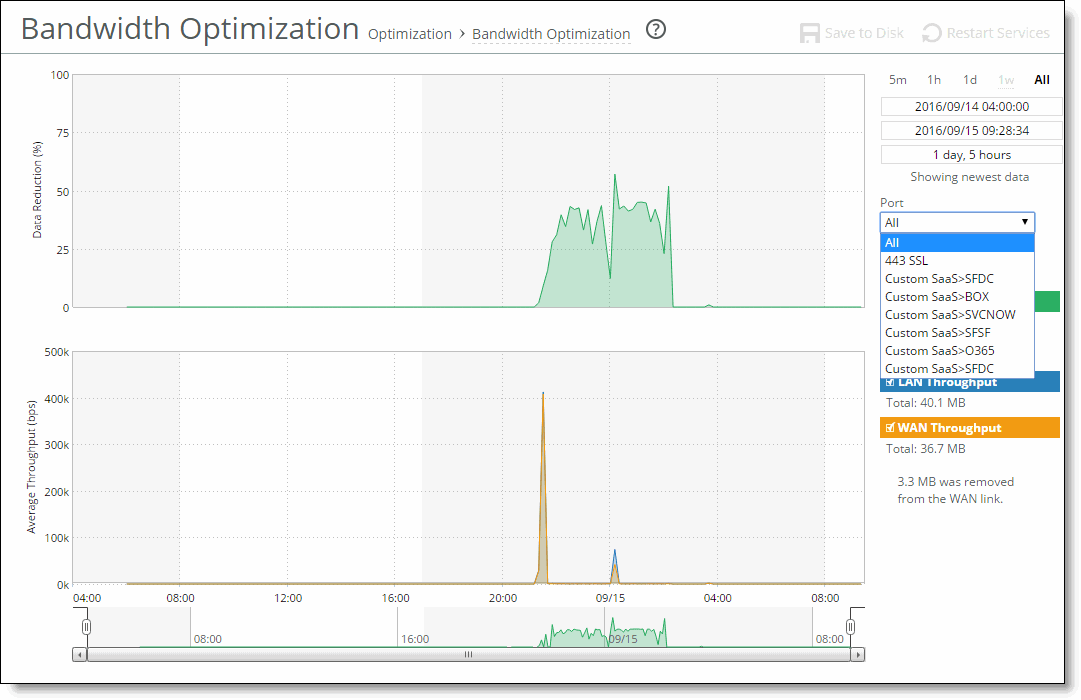
Starting with RiOS 9.5, you can view optimization statistics for SaaS applications. This report lists the optimized traffic by SaaS application instead of by port number, and the ID for the SaaS application is listed in the Port column. To configure SaaS applications for optimization by the SteelHead, see
About SaaS Accelerator.
SaaS application statistics are not included with the overall statistics for port 443 and port 80.
When using a role-based management (RBM) user, ensure that the RBM user has at least Read-Only permissions for the Cloud Optimization role, or the user will not be able to view the SaaS application names.
To find the definition of the application ID that is listed in the Port column, open the Optimization > Cloud Accelerator page. The ID (for example, SFDC) and application name (for example, Salesforce.com) are listed in the Application ID and SaaS Application Control fields.
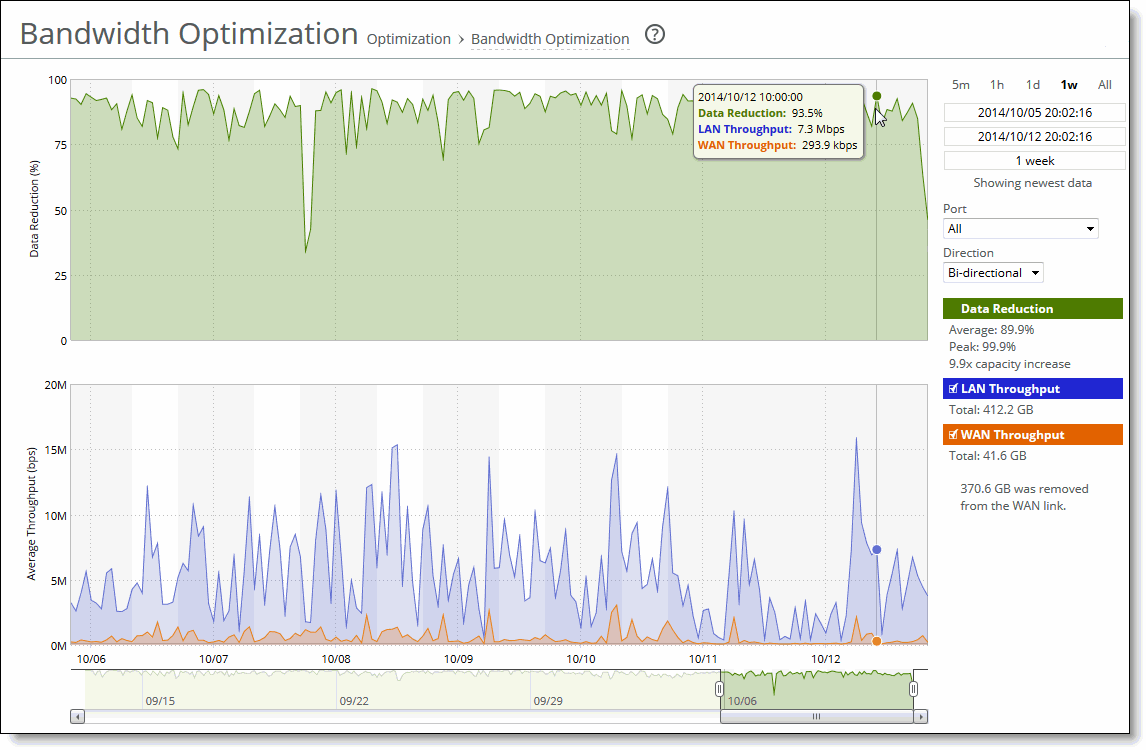
The Bandwidth Optimization report includes these statistics describing bandwidth activity for the time period you specify:
Data Reduction % displays the peak and total decrease of data transmitted over the WAN, according to this calculation:
(Data In – Data Out)/(Data In)
which displays the capacity increase x-factor below the peak and total data reduction percentages.
WAN and LAN Throughput, depending on which direction you select, specifies one of these traffic flows:
• Bi-Directional—traffic flowing in both directions
• WAN-to-LAN—inbound traffic flowing from the WAN to the LAN
• LAN-to-WAN—outbound traffic flowing from the LAN to the WAN
The navigator shadows the data reduction series.
The Bandwidth Optimization report answers these questions:
• How much data reduction has occurred?
• How much data was removed from the WAN link?
• How much data was sent/received on the LAN/WAN ports?
• Which SaaS applications are being optimized? (RiOS 9.5 and later)
Mouse over a specific data point to see what the y values and exact time stamp were in relation to peaks.
The Riverbed system reports on performance for periods up to one month. Due to performance and disk space considerations, the display granularity decreases with time passed since the data was sampled with a granularity of 5 minutes for the day, 1 hour for the last week, and 2 hours for the rest of the month.
You view the Bandwidth Optimization report under Reports > Optimization: Bandwidth Optimization.
Bandwidth Optimization page
Bandwidth Optimization page with drop-down list showing SaaS applications
These options are available to customize the report:
Time interval specifies a report time interval of 5 minutes (5m), 1 hour (1h), 1 week (1w), All, or type a custom date. All includes statistics for the past 30 days. Time intervals that don’t apply to a particular report are dimmed. For a custom time interval, enter the start time and end time using this format:
YYYY/MM/DD HH:MM:SS
Because the system aggregates data on the hour, request hourly time intervals. For example, setting a time interval to 08:30:00 to 09:30:00 from 2 days ago doesn’t create a data display, whereas setting a time interval to 08:00:00 to 09:00:00 from 2 days ago will display data.
When you request a custom time interval to view data beyond the aggregated granularity, the data is not visible because the system is no longer storing the data. For example, these custom time intervals don’t return data because the system automatically aggregates data older than 7 days into 2-hour data points:
• Setting a 1-hour time period that occurred 2 weeks ago.
• Setting a 75-minute time period that occurred more than 1 week ago.
You can view the newest data and see data points as they’re added to the chart dynamically. To display the newest data, click Show newest data.
Port specifies a port or All to select all ports from the drop-down list.
If your SteelHead appliance is SaaS-enabled, select the SaaS application from the drop-down list. To see the definition of the SaaS application (for example, SFDC in the drop-down list refers to Salesforce.com), log in to the Cloud Portal. The application names and acronyms are listed in the SaaS Services Summary pane.
Direction specifies a traffic direction (Bi-Directional, WAN to LAN, or LAN to WAN) from the drop-down list.