About the Management Console
Each acceleration appliance includes a browser-based interface for easy configuration and management. After installing an appliance and doing the initial setup, you can complete custom configurations using this console.
The Management Console works with the latest versions of browsers from Google, Mozilla, and Microsoft. JavaScript and cookies must be enabled in your web browser.
If you prefer, you can also use the Riverbed command-line interface (CLI) for configuration, monitoring, and troubleshooting.
To log in, you need the appliance URL and user credentials. By default, the administrator login is admin with no password. The URL uses this format: <protocol>://<host>.<domain>
The <protocol> variable is http or https. We recommend HTTPS for secure access. When using HTTPS, the system prompts you to verify a self-signed SSL/TLS certificate. This certificate is regenerated if you change the hostname or when it expires. This certificate is not stored in the appliance's secure vault.
The <host> variable is the hostname assigned to the appliance’s primary interface during initial configuration. Optionally, you can specify the DNS name.
The <domain> variable is the full domain name for the appliance.
Alternatively, you can specify the IP address instead of the host and domain name.
The login page will vary depending on the authentication method set up. After logging in, you’ll land on the Dashboard, which shows system status and key summary information.
About the dashboard
The Dashboard shows the system hostname in the upper-left corner, along with a colored icon that indicates system health: Healthy, Admission Control, Degraded, or Critical. You can also check system health in the System Status section.
Management Console dashboard
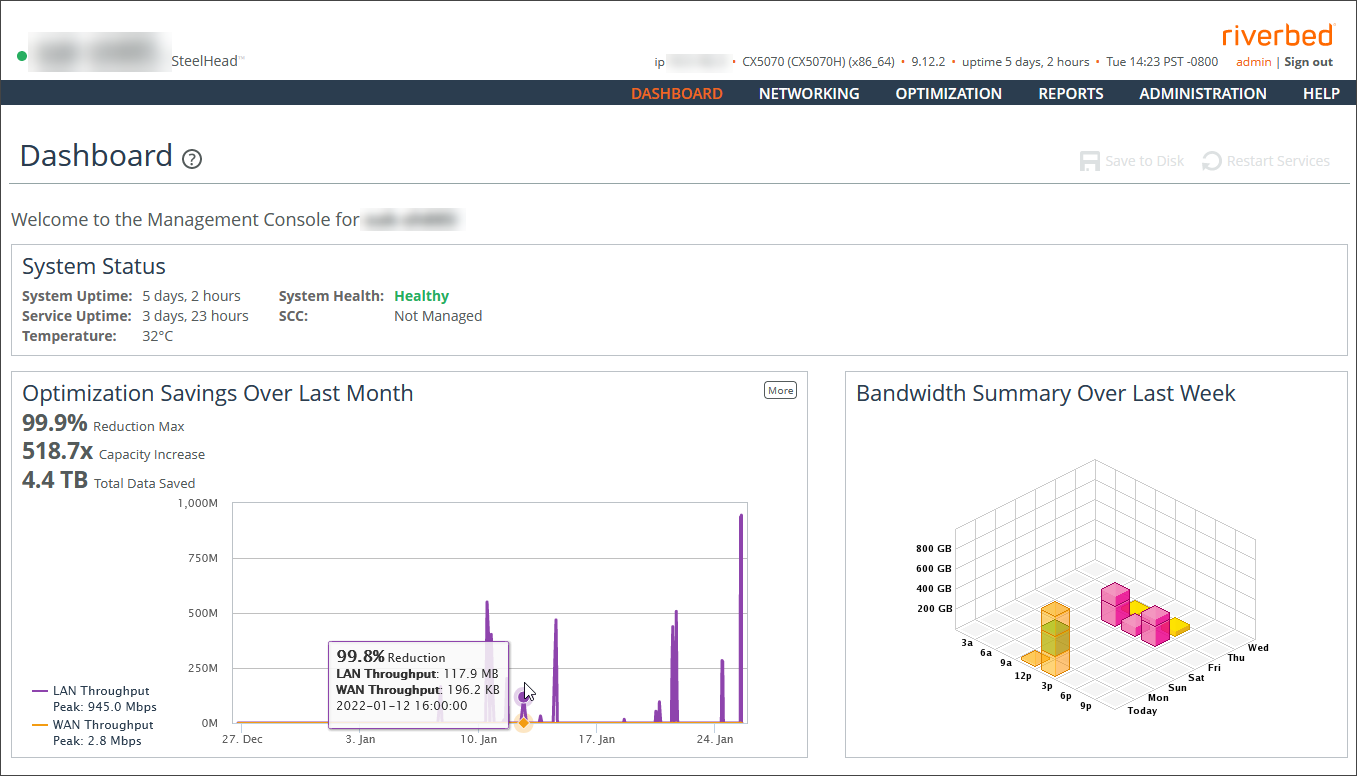
The Dashboard also displays these summary reports:
System Status
Displays the system up time, service up time, temperature, system health and the SCC hostname (if you have one in your network).
Optimization Savings Over Last Month
Summarizes the average bandwidth reduction, average capacity increase, and total amount of data saved for the month. Mouse over the graph to view statistics for a specific time. You can also see WAN and LAN peak throughput (total optimized data transmitted for all applications) in the last month.
Bandwidth Summary Over Last Week
Provides a three-dimensional view of traffic patterns (byte counts) over the last week. Each column represents the number of bytes, the time of day, and the day of the week. For example, the report might display that there were 4 GB of WAN traffic from 12 P.M. to 3 P.M. on Wednesday of the prior week.
Navigating in the Management Console
The Management Console uses cascading menus. Mouse over a menu to display its options. Click an option to display that Management Console page.
Saving your configuration
Most Management Console pages include an Apply button. When you click Apply, your configuration changes are applied to the running configuration. If you want to save your changes permanently, you’ll need to click Save to Disk.
A red outline around a setting indicates that it’s required. You must specify a valid entry for all of the required items before you can apply or save your changes.
Restarting the optimization service
The optimization service is a background process that handles traffic optimization. Some settings affect how the service works. If you change these settings, you must restart the service for the changes to take effect.
To restart the service, click Restart Services or choose Administration > Maintenance: Services and then restart the service from the Services page.
Signing out
Click Sign out in the upper-right corner of the page to sign out of the current session.
Printing pages and reports
You can print Management Console pages and reports using the print option on your web browser.
Getting help
The Help page provides this information:
Online Help
Displays browser-based online help.
Technical Support
Displays links and contact information for Support.
Appliance Details
Displays appliance information such as model number, hardware revision type, serial number, and, for virtual appliances, Support ID. Support IDs are used to track your Support cases, and you might be asked to provide them when contacting Riverbed Support.
Software Version(s)
Displays the RiOS version and build number.
MIB Files
Displays Riverbed and appliance MIB files in text format.
Each page in the Management Console includes a link to page-specific help. Click the question mark (?) icon next to the page title to display the help topic for that page.
About next steps
This guide assumes you’ve already chosen the right deployment setup, installed the appliance, and completed the initial configuration wizard. If not, refer to our setup guides or contact Riverbed Support for help.
Once the initial setup is done, you can customize the appliance for your needs. Here are some common next steps:
• Set general service options, including enabling out-of-path support.
• Create groups (labels) for hosts, ports, and domains to simplify configuration in large environments.
• Set peering rules (for client-side appliances) to define how they connect with server-side appliances.
• Configure in-path rules (for in-path deployments) to control how the appliance handles connection probes and traffic.
• Enable protocol-specific acceleration, including for secure traffic.
• Set up QoS profiles and path selection rules to prioritize important application traffic.
• Define sites and networks to help with traffic shaping and routing.
• Assign admin roles and user access to share management responsibilities securely.
• Set up failover behavior for reliability.
• Configure admin settings, like alerts, SNMP, logging, security, and maintenance options.