Monitoring the Network
Viewing your topology
The dashboard map offers a unified at-a-glance view of your network topology, including a summary of the established tunnels, tunnels that need attention, sites under construction, and new events. It also provides continuous automatic monitoring of network events and site status.
To view the dashboard
•Select Dashboard.
Multiple sites within an organization
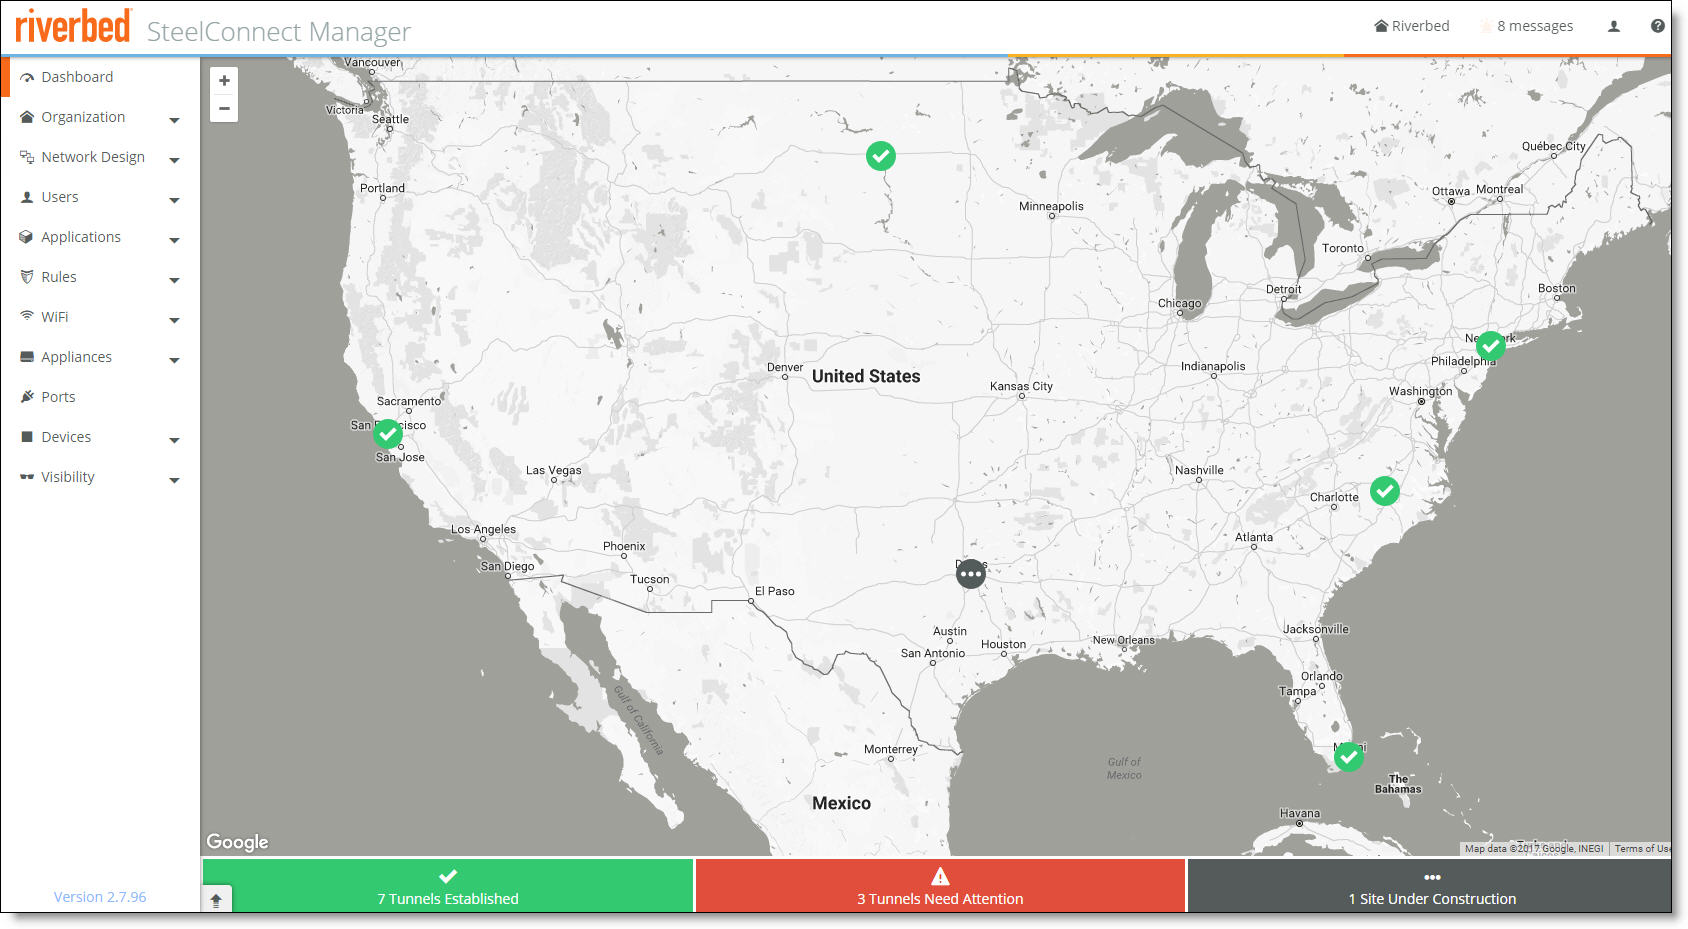
The Google Map displays the sites within an organization.
Viewing tunnel status
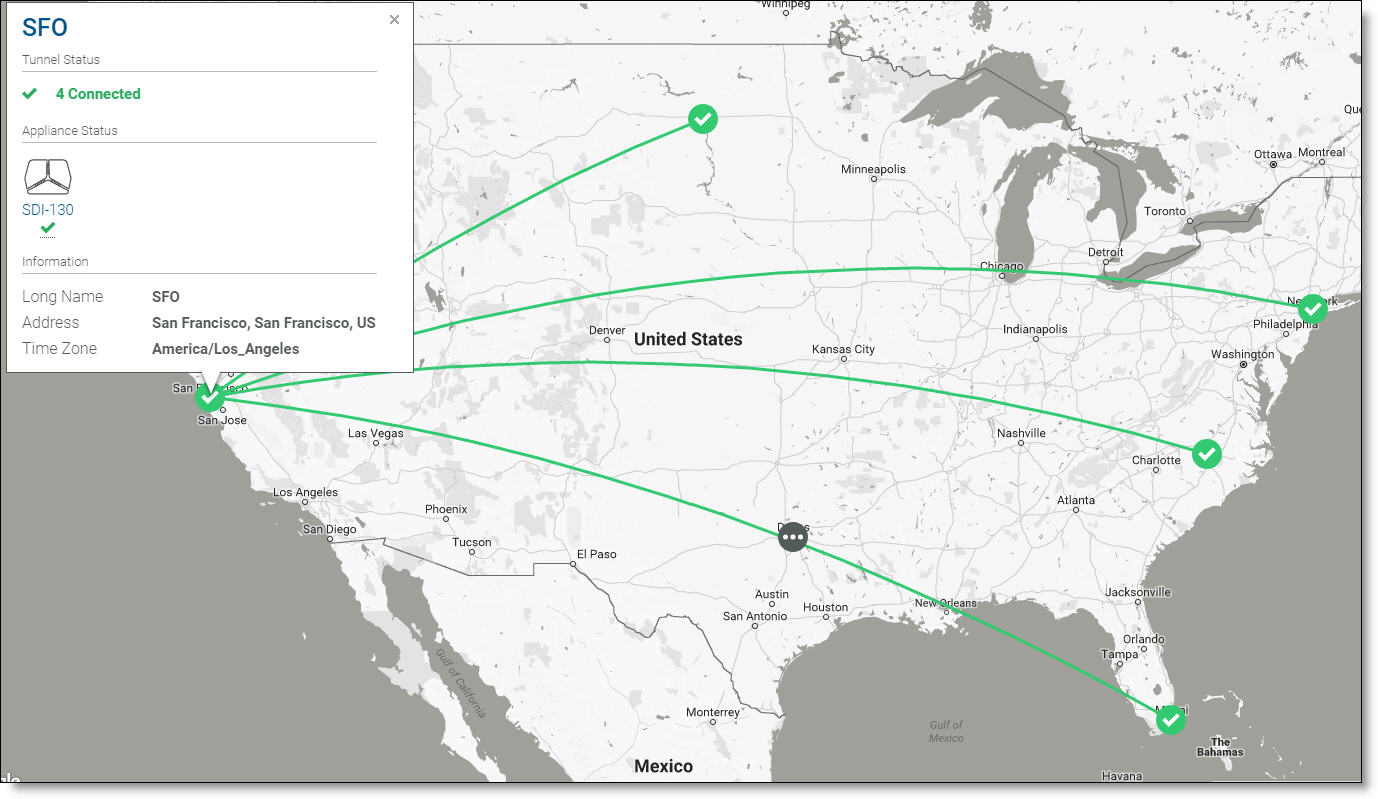
The dashboard displays the tunnels in the full-mesh network after you click a site marker.
To view tunnel status
1. On the dashboard map, click the site marker.
Viewing tunnel status
2. Click the green line indicating a path.
Path quality reports metrics on established and functional tunnels, throughput, and path quality. For details, see
Monitoring path quality.
•Green line - Indicates that the VPN tunnel is successfully established.
•Red dashed line - Indicates that the VPN tunnel can’t be established or is down.
•Gray dashed line - Indicates that the VPN tunnel is under construction.
Viewing site and appliance status
You can monitor the real-time status of your sites along with the appliance status from the dashboard.
You can also monitor path quality metrics if you’re using path selection. For details, see
Monitoring path quality.
To view site status
•On the dashboard map, click the site marker.
The site’s tunnel status, appliance status, and location appear:
•Green - SCM measures the AutoVPN health of a site as a whole. As long as there is one AutoVPN tunnel from that site to another, it shows a green check mark for the site status. Green indicates that some or all tunnels associated with the site are established.
•Gray - A gray dashed icon indicates that the site is under construction. This includes:
–sites that are in the process of being defined within SCM, but are not yet live with actual appliances
–sites with shadow appliances.
•Red - A red icon indicates that there is a problem with the site.
•If the city for a site is invalid, a purple question mark appears in an ocean on the dashboard map.
Invalid city marker for a site

–Click the marker to view the invalid address. Click the invalid address to go to the Location tab where you can fix the city.
To return to the dashboard, click the site marker again.
Displaying online help
To display online help
1. Click the question mark (?) icon in the upper-right corner.
2. Choose SteelConnect Help.
The help appears in a new browser tab.