Monitoring SaaS data usage
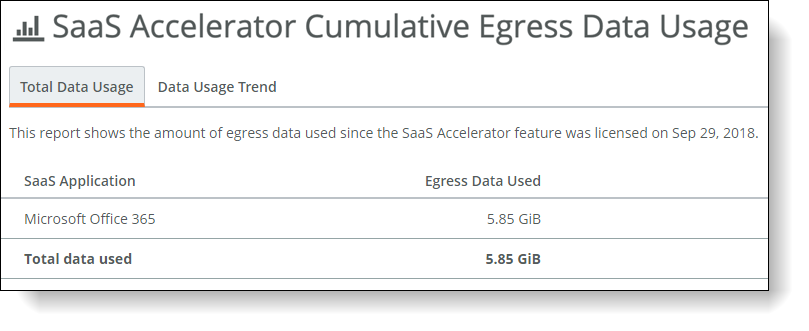
The SaaS Data Usage report shows the amount of SaaS service data used since the SaaS Accelerator feature was licensed.
SaaS total data usage
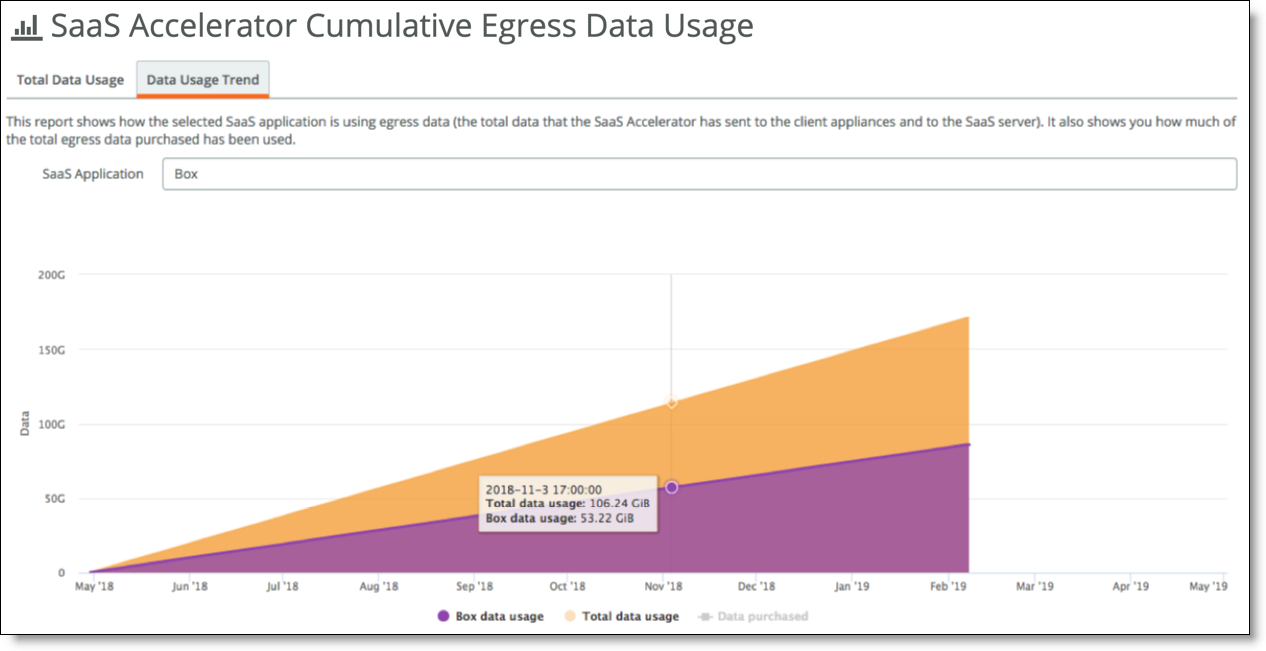
SaaS data usage trend
To view data usage
1. Choose Reports > Data Usage.
The SaaS Accelerator Cumulative Egress Data Usage page shows the usage history.
2. Select the Data Usage Trend tab to view application-specific data usage and see how application usage compares to overall usage.
Select Data Purchased (under the graph) to show how your data usage compares to the data limit provided by your license.
Monitoring data reduction for accelerated SaaS traffic
The SaaS Traffic Summary page has two tabs:
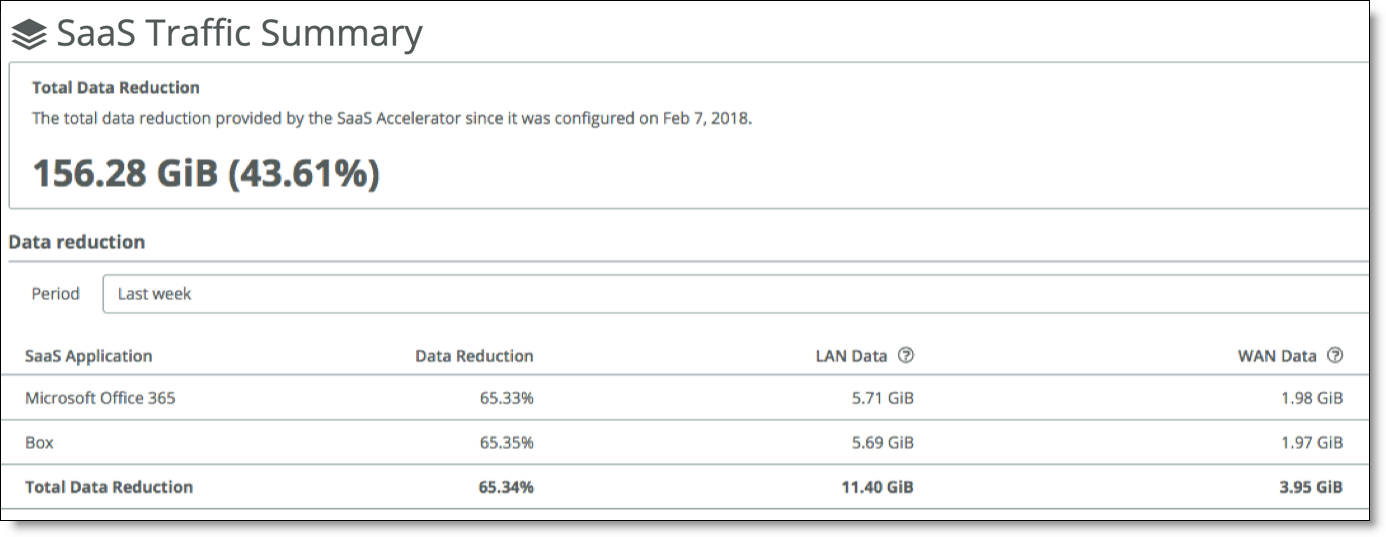
• Total Data Reduction - Shows the total data reduction provided by SaaS Accelerator since it was configured and lets you filter it by time period. The report also shows the data reduction for each configured SaaS application.
SaaS Data Reduction report
To view data reduction
• Choose Reports > Traffic Summary.
The SaaS Traffic Summary page shows the overall data reduction and application details.
You can filter the results by time period ranging from the last hour to the last year.
The LAN Data column displays the amount of data transferred between the SaaS service cluster and the SaaS servers. The LAN data includes ingress and egress traffic on the SaaS LAN side.
The WAN Data column displays the amount of data transferred between the SaaS service cluster and the client-side appliances. The WAN data includes ingress and egress traffic on the WAN side.
Data Reduction is a percentage based on LAN data compared to WAN data.