Viewing the Export I/O Metrics report
The Export I/O Metrics report summarizes the standard I/O data traffic read from and written to the selected export for the specified period of time.
This report can display three graphs:
• I/O
• I/O Operations Per Second
• I/O Latency
What this report tells you
The Export I/O Metrics report answers these questions:
• How many mebibytes (MiB) have been prefetched, written to, and read from the selected export for the specified period?
• How frequently were I/O operations written to and read from the selected export for the specified period?
• What are the average read and write latencies for the selected export for the specified period?
To view the Export I/O Metrics report
1. Choose Reports > Storage: Export I/O Metrics to display the Exports I/O Metrics page.
Figure: Export I/O Metrics page
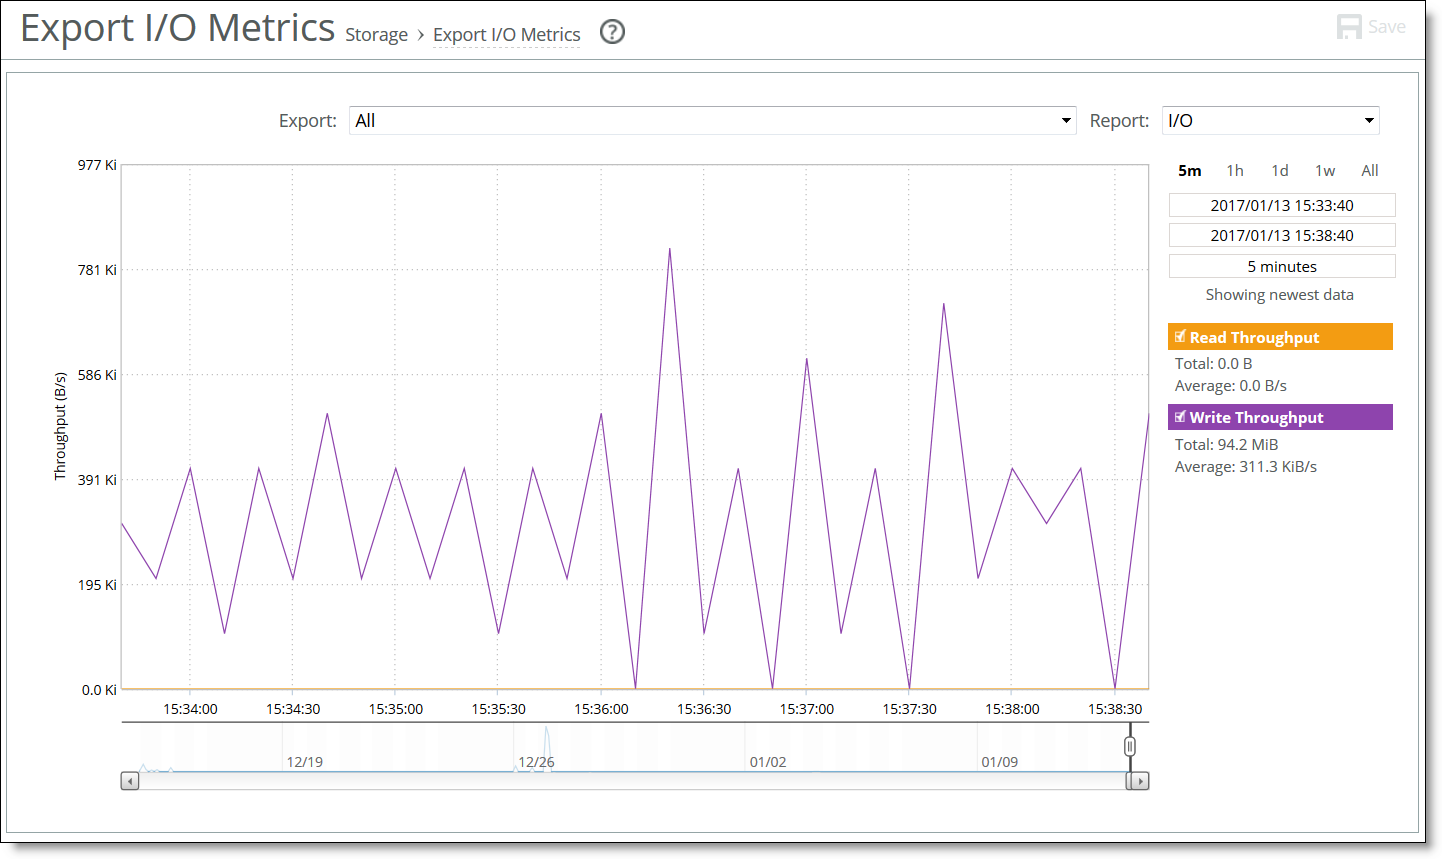
2. Customize the report using the controls described in this table.
Control | Description |
Export | Select the export whose statistics you want to see from the drop-down list, or choose All. |
Report | Select the export report to display from the drop-down list: • I/O - read and write throughput • I/O Operations Per Sec - read and write I/O operations per second. • I/O Latency - read and write I/O latency |
Period settings | Click 5m (last five minutes), 1h (last hour), 1d (last day), 1w (last week), or All (last month). For a custom time period, specify the start and end times in the fields immediately below these settings. Use the following format: yyyy/mm/dd hh:mm:ss. You can also use the adjustable slider at the bottom of the graph. |
Report type | Toggle the reports to be displayed by clicking the type heading. The types of reports available depends on the type of export report selected above. |
About report graphs
In bar-graph and line-graph reports, the x-axis (or tick mark) plots time, according to the interval that you select. The y-axis plots the metric of interest, such as gibibytes (GiB) of bandwidth, percent of data reduction, connection counts, and so on.
The right margin of the graph points to the value on the y-axis (for example, the percent) that is the average value for the time period selected.