Viewing the SteelFusion Edge statistics
The SteelFusion Edge Stats report gives you a high-level performance overview of all configured Edges running version 3.6.0 and later that are connected to the current Core. The configured Edges send their statistics every five minutes to the Core. The Core then displays this point-in-time information in the report, giving you a network-wide view of valuable details about how they are performing.
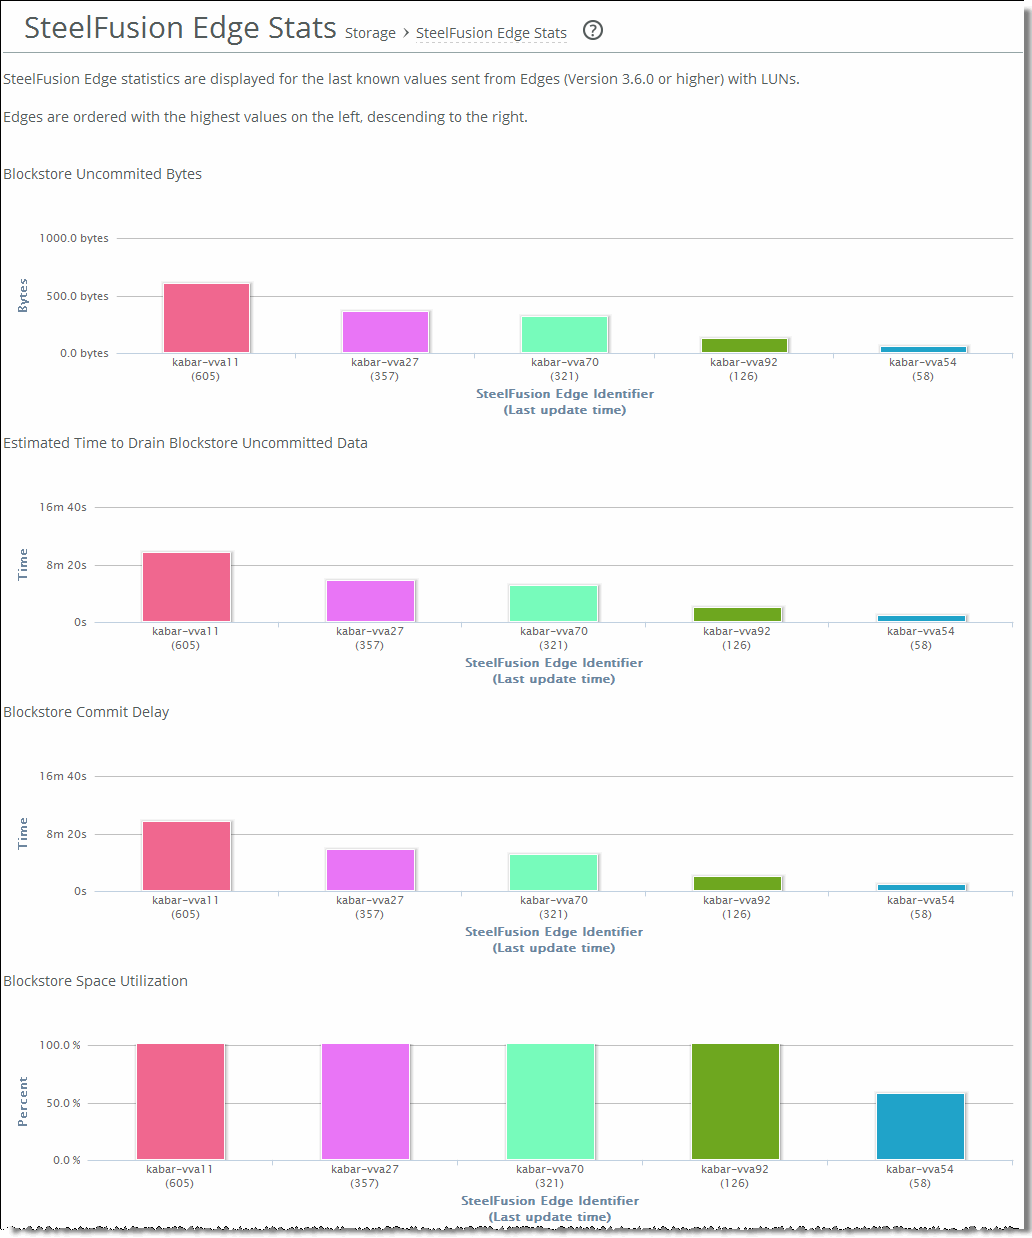
The highest values are displayed on the left and descend to the right, enabling you to easily identify any Edges with performance problems. Each Edge is assigned a color so you can compare statistics between several Edges at a glance.
If you have set up the Core for high availability, the SteelFusion Edge Stats report only displays Edges that are served by individual Cores. If one Core is down, the report shows Edges served by both Cores, however on separate pages.
This report displays the following statistics:
• Blockstore Uncommitted Bytes
• Estimated Time to Drain Blockstore Uncommitted Data
• Blockstore Commit Delay
• Blockstore Space Utilization
• Read I/O Latency (All exports)
• Write I/O Latency (All exports)
What this report tells you
The SteelFusion Edge Stats report answers these questions:
• How many bytes of uncommitted data is currently in the blockstore?
• What is the estimated time (in seconds) to drain the uncommitted blockstore data back to the Core?
• How long is the delay (in seconds) to commit the blockstore data? For example, if the value is 1d 3h, and the Edge at the branch office is down, any data written at the Edge in the last 1d 3h will be lost.
• What percentage of the blockstore is currently being used by uncommitted data?
• What is the average read and write I/O latency (in milliseconds) over the last hour for all exports?
To view the SteelFusion Edge Stats report
• Choose Reports > Storage: SteelFusion Edge Stats to display the SteelFusion Edge Stats page.
Figure: SteelFusion Edge Stats page

Note: If the Edge becomes disconnected, the report shows last received statistics until it is reconnected. If the Edge becomes idle, it continues to report statistics to the Core even if individual values don’t change.
About report graphs
In bar-graph and line-graph reports, the x-axis (or tick mark) plots time, according to the interval you select. The y-axis plots the metric of interest, such as gibibytes (GiB) of bandwidth, percent of data reduction, connection counts, and so on.
The right margin of the graph points to the value on the y-axis (for example, the percent) that is the average value for the time period selected.


