Accessing settings from storage reports
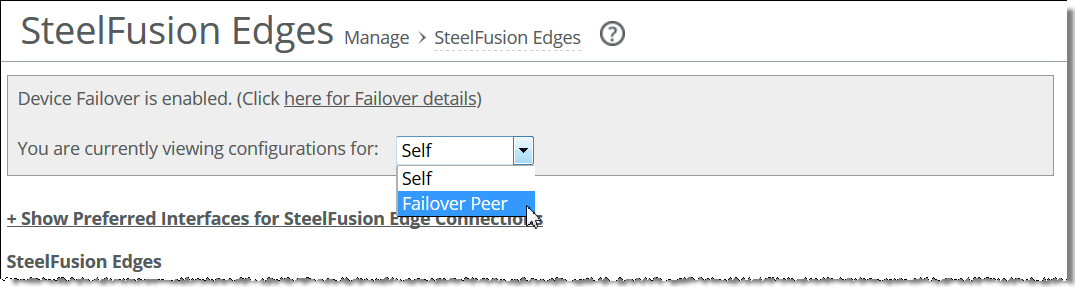
If you configure the current Core for failover with another device, all Storage report pages include a pane with a link to failover details. Click the link to jump to the Configure > Failover: Failover Configuration page and the current settings.
This pane appears below the page title, and it also includes a drop-down list from which you can select Self (the current appliance) or Failover Peer. Changing the selection displays the reports for those Cores.
Note: A message in this pane clarifies that viewing reports for all exports, Edges, or storage arrays includes data from both Self and Peer, regardless of the selection from the drop-down list.
Figure: Sample page with Failover pane
About report graphs
In bar-graph and line-graph reports, the x-axis (or tick mark) plots time, according to the interval you select. The y-axis plots the metric of interest, such as gibibytes (GiB) of bandwidth, percent of data reduction, connection counts, and so on.
The right margin of the graph points to the value on the y-axis (for example, the percent) that is the average value for the time period selected.