Viewing appliance TCP memory reports
The TCP Memory report simplifies the analysis of unexplainable throughput degradations, stalled and timed-out connections, and other network-related problems by providing the history of the TCP memory consumption and any TCP memory pressure events detected during network traffic processing. Use this report to gather preliminary information before calling Riverbed Support to troubleshoot an issue.
For details about operating report controls, see
Overview.
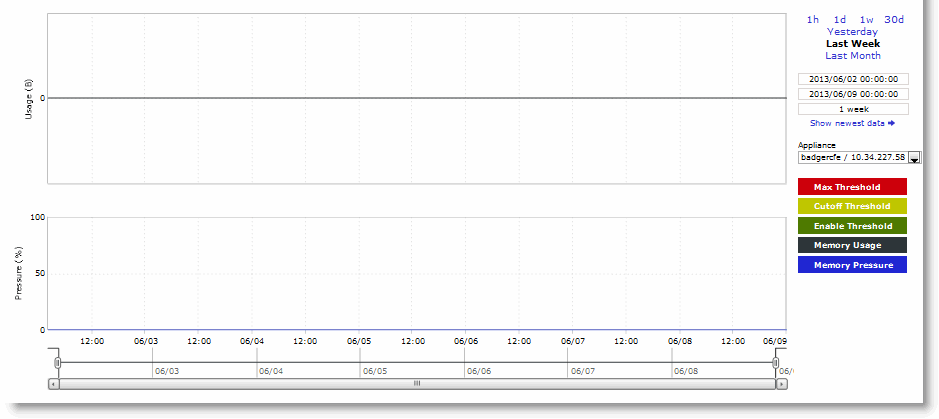
The TCP Memory report includes two graphs. The TCP usage graph provides the absolute number of memory bytes allocated by the TCP subsystem. This graph includes these statistics that describe TCP memory activity for the time period you specify.
Data Series | Description |
Max Threshold | Displays the absolute maximum amount of memory bytes that the TCP stack can allocate for its needs. |
Cutoff Threshold | Displays the number of memory bytes allocated until the TCP memory allocation subsystem doesn’t apply memory saving mechanisms and rules. As soon as the TCP memory consumption reaches the cutoff limit, the TCP stack enters a “memory pressure” state. This state applies several important limitations that restrict memory use by incoming and transmitted packets. In practice, this means that part of the incoming packets can be discarded, and user space code is limited in its abilities to send data. |
Enable Threshold | Displays the lower boundary of TCP memory consumption, when the memory pressure state is cleared and the TCP stack can use the unlimited memory allocation approach again. |
Memory Usage | Displays the average memory consumption by the TCP/IP stack. |
Memory Pressure | Displays the maximum percentage of time that the kernel has spent under TCP memory pressure. |
The navigator shadows the memory usage series.
In many cases, even an insignificant increase in network traffic can cause TCP memory pressure, leading to negative consequences. There are many conditions that can cause TCP memory pressure events. However, all of the events can be sorted into these two categories to identify the bottleneck in the data transfer chain:
• Slow client cases - Occur when the receiver (client) isn’t able to accept data at the rate the client-side SteelHead or the server-side SteelHead transfers data. This condition usually causes two TCP memory pressure points—one on the sender's side and another one on the receiver's (client's) side. The slow client on the sender's side (usually the client-side SteelHead) is characterized by a large amount of unsent data collected in the send socket buffers. Incorrect SteelHead settings, such as overly large send buffers, can trigger TCP memory pressure, even with relatively normal network traffic.
• Fast server cases - Occur when the sender is able to transfer data faster than the receiver can accept it. This condition can be triggered not only because of insufficient CPU resources, but also because of an insufficient disk transfer rate (especially with a cold and warm data pattern). The most common cause of this problem is a lack of processing power on the SteelHead.
What this report tells you
The TCP Memory report answers these questions:
• How much time is the kernel spending under TCP memory pressure?
• What is the average memory consumption for the SteelHead?
About report graphs
Use the mouse to hover over a specific data point to see the y values and exact time stamp.
For detailed information about data grouping, see
Overview.
To view the TCP Memory report
1. Choose Diagnostics > Appliance System: TCP Memory to display the TCP Memory page.
Figure: TCP Memory report

2. Use the controls to customize the report as described in this table.
Control | Description |
Time Interval | Select a report time interval of 1 hour (1h), 1 day (1d), 1 week (1w), 30 days (30d), yesterday, last week, or last month. Time intervals that don’t apply to a particular report are dimmed. For a custom time interval, enter the start time and end time using the format yyyy/mm/dd hh:mm:ss You can quickly see the newest data and see data points as they’re added to the chart dynamically. To display the newest data, click Show newest data. |
Appliance | Select an appliance from the drop-down list. |
3. Under Export, complete the configuration as described in this table.
Control | Description |
Export To | Select either the Email or URL option from the drop-down list. |
Email Addresses | (Only displays when Email is selected.) Specify the email address of the recipient. |
Email Subject | (Only displays when Email is selected.) Specify the subject. |
Destination URL | (Only displays when URL is selected.) Specify the URL. |
Format | Select HTML, CSV, or PDF from the drop-down list. |
Per Appliance Report | Enables appliance report settings. Note: Generates graphs per appliance for HTML/PDF reports. Note: Generates one CSV per appliance for CSV reports. |
Export Now | Select Export Now and click Export to start the export immediately. |
Schedule Export | Select Schedule Export and specify the start date, time, and frequency of the export. Use this format: yyyy/mm/dd hh:mm:ss |
Export | Click Export to export the configuration. |
Printable view | Displays the print menu. |


