Viewing the Optimized Throughput report
You view the Optimized Throughput report under Reports > Optimization: Optimized Throughput.
Optimized Throughput report
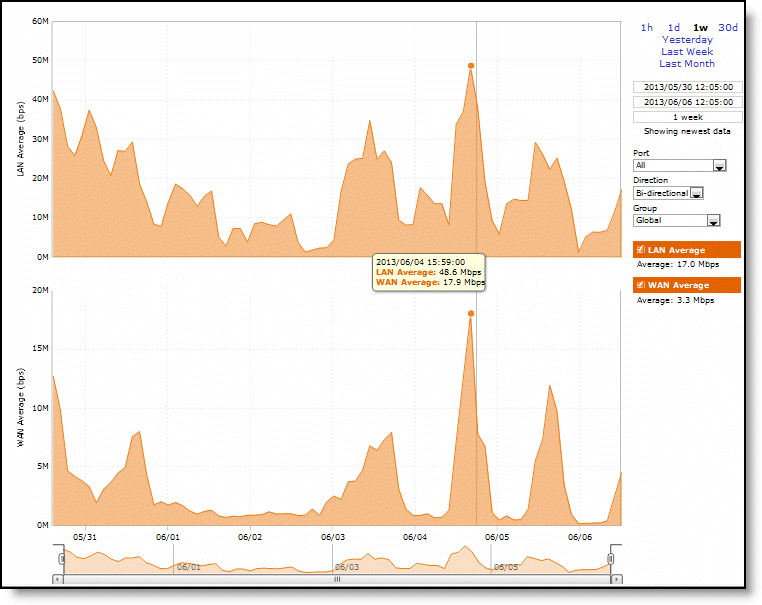
These options are available to customize the report:
Time Interval
Specifies a report time interval of 1 hour (1h), 1 day (1d), 1 week (1w), 30 days (30d), yesterday, last week, or last month. Time intervals that don’t apply to a particular report are dimmed. For a custom time interval, enter the start time and end time using the format yyyy/mm/dd hh:mm:ss
Because the system aggregates data on the hour, request hourly time intervals. For example, setting a time interval to 08:30:00 to 09:30:00 from 2 days ago doesn’t create a data display, whereas setting a time interval to 08:00:00 to 09:00:00 from 2 days ago will display data.
When you request a custom time interval to view data beyond the aggregated granularity, the data isn’t visible because the system is no longer storing the data. For example, these custom time intervals don’t return data because the system automatically aggregates data older than seven days into two-hour data points:
• Setting a one-hour time period that occurred two weeks ago.
• Setting a 75-minute time period that occurred more than one week ago
You can quickly see the newest data and see data points as they’re added to the chart dynamically. To display the newest data, click Show newest data.
Port
Specifies a port from the drop-down list. The list appends the port name to the number where available.
Direction
Specifies a traffic direction (Bi-directional, WAN to LAN, or LAN to WAN) from the drop-down list.
Group
Specifies a group from the drop-down list.