Monitoring Server Health
From the Server Health menu, you can view sensor information and event logs.
Viewing Sensor Readings
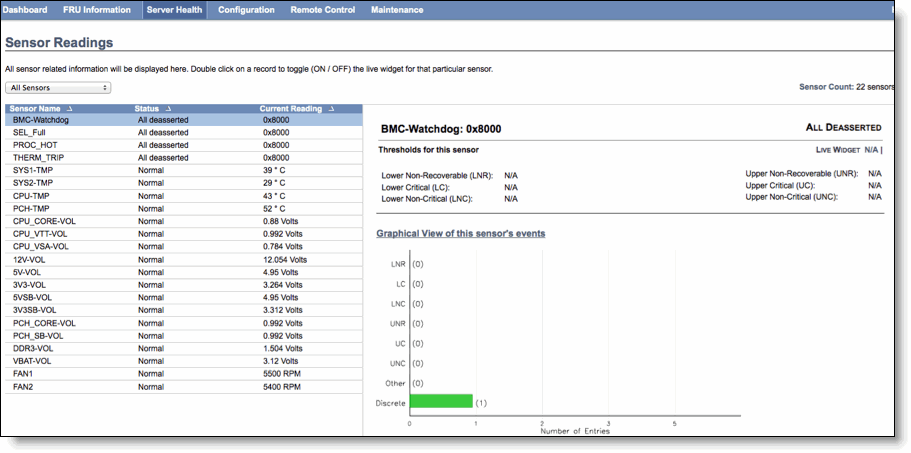
Go to Server Health > Sensor Readings to display sensors and their status. Click a sensor to display more information, including thresholds and a graphical representation of all associated events. Double click a sensor to turn on or turn off a widget that charts the sensor information.
Click View Event Log to view the log page for the selected sensor.
Figure: Sensor Readings

Viewing Event Logs
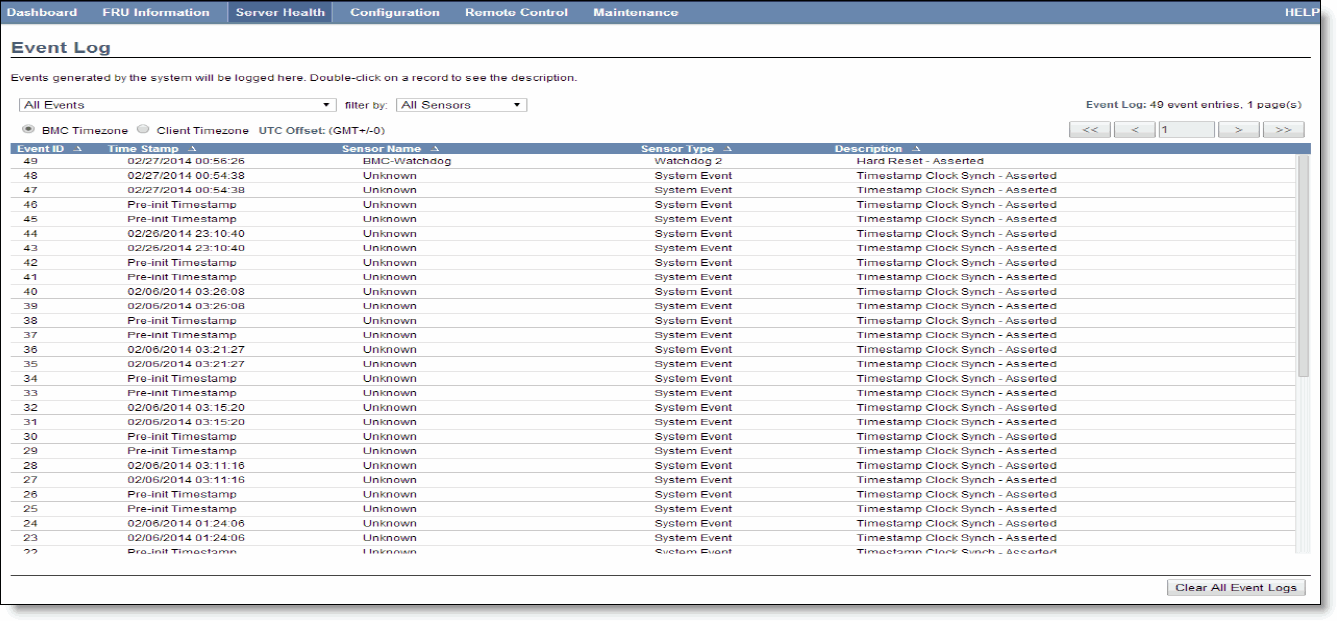
Choose Server Health > Event Logs to display a list of events incurred by different sensors on this device. Double click a record to see additional details. You can also sort the list of entries by clicking any of the column headers.
You can use the sensor type or sensor name filter options to view specific events logged in the appliance.
Figure: Event Logs
