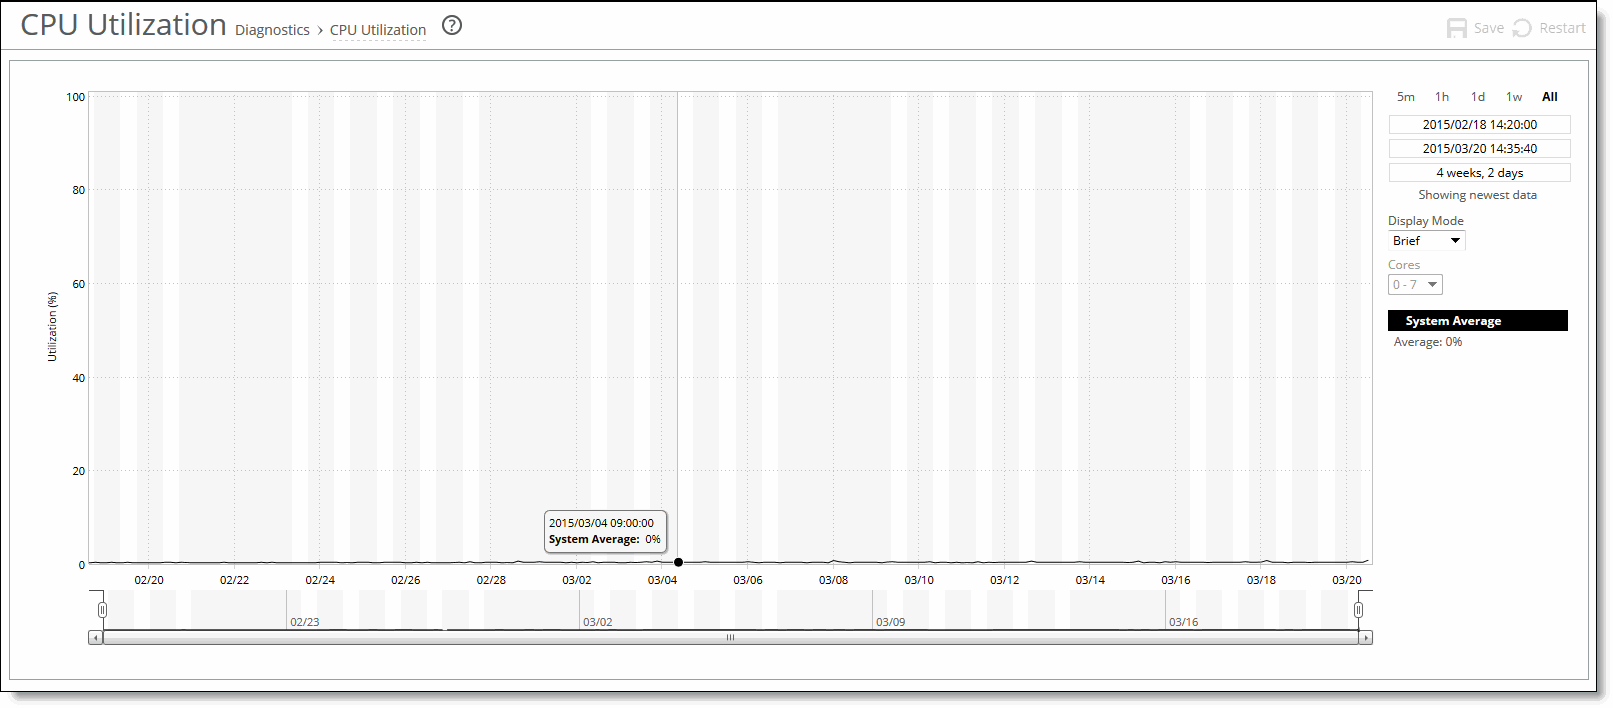
Figure: CPU Utilization page


Control | Descriptions |
Time Interval | Select a report time interval of 5 minutes (5m), 1 hour (1h), 1 day (1d), 1 week (1w), All, or type a custom date. All includes statistics for the last 30 days. Time intervals that do not apply to a particular report are dimmed. For a custom time interval, enter the start time and end time using this format: yyyy/mm/dd hh:mm:ss You can quickly see the newest data and see data points as they are added to the chart dynamically. To display the newest data, click Show newest data. |
Display Mode | Select one of these displays from the drop-down menu: • Brief - Displays the CPU utilization percentage of all cores combined as a system-wide average. • Detailed - Displays the CPU percentages for each RiOS core individually. The individual cores appear with a number and a color in the data series. To hide or display a core in the plot area, select or clear the check box next to the core name. |
Cores | Select the core number from the drop-down list. (Available only if Detailed is selected as the display mode.) |