Viewing Endpoint History reports
The Reports > Endpoints: Endpoint History report displays these statistics, which describe connected endpoint activity for the time period you specify:
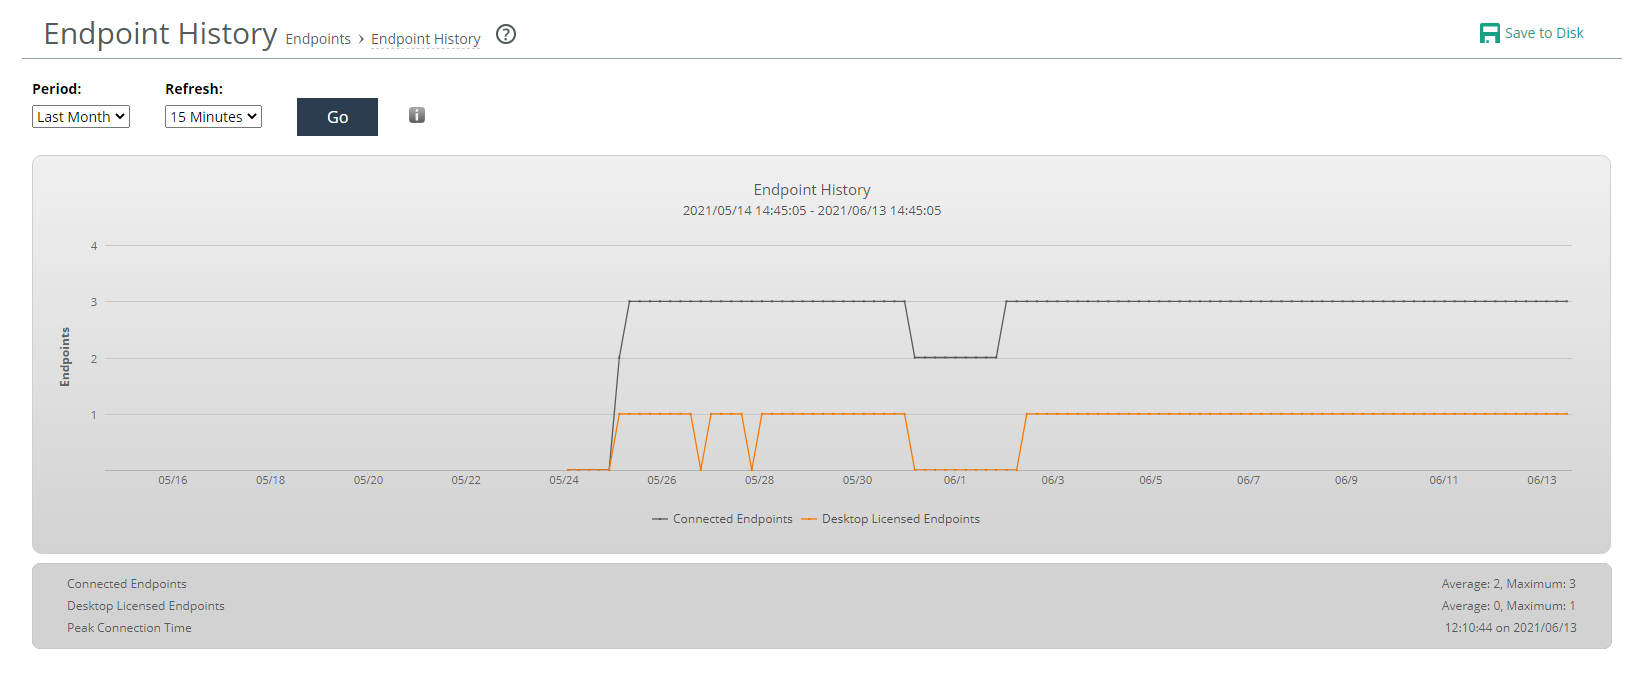
• Average Connected Endpoints—Specifies the average number of endpoint clients connected to the controller for the time period specified.
• Maximum Connected Endpoints—Specifies the maximum number of endpoint clients connected to the controller for the time period specified.
• Average Licensed Endpoints—Specifies the average number of endpoint clients licensed.
• Maximum Licensed Endpoint—Specifies the maximum number of endpoint clients licensed.
• Peak Connection Time—Specifies the time at which point the greatest number of endpoint clients were connected to the controller for the time period specified.
What this report tells you
The Endpoint History report answers these questions:
• How many endpoints connected, over time?
• When were the most endpoints connected?
• How many licenses were added in a given period?
To view the Endpoint History report
1. Choose Reports > Endpoints: Endpoint History to display the Endpoint History page.
Endpoint history with aggregated statistics
If the controller is part of a cluster and you set the aggregated statistics, the endpoint report displays time-series data aggregated across the entire cluster. A message appears at the bottom of the report stating whether the data was successfully retrieved from all the cluster members. For details, see
About Controller Clusters. If the controller is part of a cluster and you do not set aggregated statistics, the report only shows data from the current Client Accelerator Controller.
2. Manipulate the report as you like:
– Drag your cursor over an area of interest to zoom.
– After dragging, click the Reset Zoom link that appears to return to normal view.
– To hide or show an endpoint type, click that type in the graph legend.
3. Use these controls to customize the report:
– Period—Select Last Hour, Last Day, Last Week, Last Month, or Custom from the drop-down list. If you select Custom, specify a Start Time and End Time to configure a customized time interval report. Use this format for specifying a start and end time: yyyy/mm/dd hh:mm:ss
– Refresh—Select a refresh rate option for the report display: 5, 10, or 15 Minutes. Alternatively, select Off to turn off refresh. Note: The refresh rate sets the rate at which the results of polling are displayed, not the polling rate itself. Polling occurs every five minutes
4. Click Go to display the customized report.